


Pricing ROI and Breakeven Calculator — Free HTML CSS JS Snippet
Pricing ROI and Breakeven Calculator · Pricing · Plain HTML, CSS & JS · Live preview
What's included
Features
About this UI Snippet
Pricing ROI and Breakeven Calculator — Turn Current Spend and Hours into a Live Savings Number
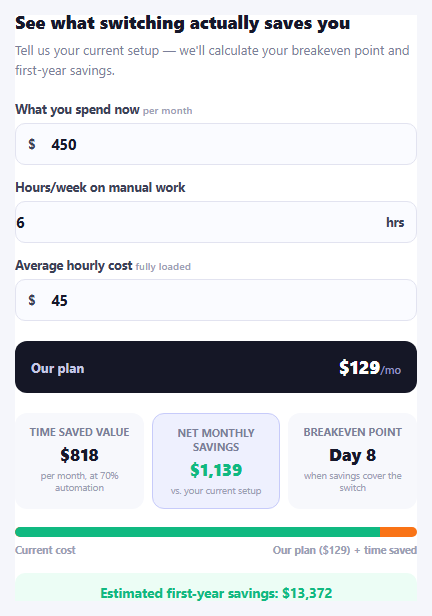
A price tag alone answers "how much does this cost" — it never answers "is this actually worth it for me." This snippet answers the second question directly: a visitor enters what they currently spend and how many hours a week they lose to manual work, and the widget calculates a monthly savings figure, a breakeven day count, and a projected first-year number, all recalculating live as the inputs change.
Turning hours into dollars, deliberately conservative
recalc() converts weekly hours into a monthly figure (hoursPerWeek * WEEKS_PER_MONTH, using 4.33 as the average weeks-per-month rather than a round 4, which would systematically undercount), then applies a fixed AUTOMATION_RATE of 0.7 — assuming the product only automates 70% of that manual work, not all of it. This is deliberate: claiming 100% automation would read as marketing hype and undermine trust in every other number on the card; a partial, named assumption reads as credible instead.
Net savings is spend replaced plus time recovered, minus the new cost
netSavings = (currentSpend + timeValue) - totalNewCost — the visitor's existing spend is treated as fully eliminated (replaced by the new plan), and the dollar value of recovered time is added on top, then the new plan's price is subtracted. This is why a visitor with modest current spend but a lot of manual hours can still see a strongly positive number: the time-value term often outweighs the spend term.
Breakeven is a real division, not a hardcoded promise
Rather than displaying a generic "pays for itself fast!" line, breakevenDays is computed as (SWITCH_COST / netSavings) * 30 — a fixed one-time SWITCH_COST divided by the *monthly* net savings, scaled into a day count. A visitor whose net savings are small sees a longer, honest breakeven window; one whose savings are large sees it converge toward "Day 1." If netSavings is zero or negative, the breakeven figure explicitly reads "N/A" rather than showing a nonsensical or infinite number.
The comparison bar's fill is computed, not decorative
The two-color bar's green fill width is derived from totalNewCost's share of the three-way combined total (current spend, time value, and new cost), inverted and clamped between 8% and 92% so neither side of the bar ever fully vanishes regardless of how lopsided the numbers get — a full 0% or 100% fill would misleadingly suggest one side costs literally nothing.
Year projection subtracts the switch cost once, not monthly
yearSavings = netSavings * 12 - SWITCH_COST — the one-time onboarding cost is subtracted a single time from the annualized monthly savings, not deducted every month, which would understate the real first-year number. If the result comes out negative, the label switches from "savings" to "cost" language rather than showing a misleading negative "savings" figure.
Customizing it
Adjust PLAN_PRICE, AUTOMATION_RATE, and SWITCH_COST to match your actual product's pricing and realistic automation rate — these three constants drive every number on the card. Swap the "hours + hourly rate" framing for a different cost model (e.g. per-transaction fees) by changing what timeValue represents in recalc(); the rest of the calculation chain (net savings, breakeven, year projection) stays the same shape.
Step by step
How to Use
- 1Enter your current monthly spendWhat you pay today for the tool or process this plan replaces.
- 2Enter weekly manual hours and hourly costThe calculator assumes 70% of that time gets automated by the plan.
- 3Read the three result tilesTime saved value, net monthly savings, and the breakeven day all update live.
- 4Check the comparison barVisualizes your current cost against the new plan price plus time value recovered.
- 5Read the first-year projectionAnnualized savings minus a one-time switch cost, shown at the bottom.
- 6Adjust the assumptionsEdit PLAN_PRICE, AUTOMATION_RATE, and SWITCH_COST in the JS panel to match your product.
Real-world uses
Common Use Cases
Got questions?
Frequently Asked Questions
Claiming that every manual hour disappears would read as marketing hype and undermine trust in the rest of the numbers on the card. A named, partial AUTOMATION_RATE constant (0.7) produces a more credible, defensible savings figure, and it is a single constant you can tune to match your actual product's real automation coverage.
A fixed one-time SWITCH_COST (representing onboarding/migration effort) is divided by the calculated monthly net savings, then scaled by 30 to express it as a day count: (SWITCH_COST / netSavings) * 30. If net savings are zero or negative, the calculator shows "N/A" instead of a nonsensical or infinite breakeven figure.
It is the visitor's current monthly spend plus the calculated dollar value of the manual hours saved, minus the new plan's price: (currentSpend + timeValue) - totalNewCost. Current spend is treated as fully replaced by switching, and the recovered-time value is added on top before subtracting what the new plan costs.
yearSavings is calculated as netSavings * 12 minus SWITCH_COST a single time, because the onboarding/migration cost is a one-time expense, not a recurring monthly one. Subtracting it every month would significantly understate the real first-year savings figure.
The net savings figure switches to red text with a leading minus sign, the breakeven tile shows "N/A" instead of a misleading day count, and the bottom summary line switches its wording from "Estimated first-year savings" to "Estimated first-year cost" — the calculator never hides or mislabels a negative outcome as a positive one.
Edit the PLAN_PRICE, AUTOMATION_RATE, SWITCH_COST, and WEEKS_PER_MONTH constants near the top of the JS panel. All of recalc()'s downstream math (time value, net savings, breakeven, and the year projection) reads from these constants, so changing them updates every derived number consistently.
Build with AI
Build, Understand, Optimize, and Extend It With AI
Rather than reverse-engineering the ROI math by hand, paste this snippet's HTML, CSS, and JS into an AI coding assistant like Claude and ask it to explain exactly how recalc() turns weekly hours and an hourly rate into a monthly dollar figure using a conservative automation-rate assumption, and why the breakeven calculation divides a fixed one-time switch cost by monthly (not annual) net savings before scaling it into a day count. The same assistant can help you extend it — ask it to add a second competitor-comparison column so a visitor sees savings against two current tools at once, chart the cumulative savings over 12 months as a small line instead of a single bar, or validate the input fields so a visitor cannot enter negative numbers that would produce a nonsensical result. It's also useful for a credibility review: ask whether the fixed 70% automation assumption and the fixed one-time switch cost should instead be configurable sliders so visitors can stress-test the numbers themselves, which tends to build more trust than a single fixed estimate. Treat the code less like a finished artifact and more like a starting point for a conversation.
Prompt to recreate it
Copy this into your AI assistant of choice to build the effect from scratch, or as a jumping-off point for your own variant:
Build a pricing ROI and breakeven calculator card in plain HTML, CSS, and vanilla JavaScript — no chart library, no framework.

Requirements:
- Three number inputs: current monthly spend on the tool/process being replaced, hours per week spent on manual work, and an average fully-loaded hourly cost for that work — plus a fixed display of this product's own monthly plan price.
- Live-recalculate on every input change (not on a submit button): convert weekly hours into a monthly figure, apply a clearly named partial automation-rate constant (e.g. 0.7, not 1.0 — do not claim 100% of manual work disappears) to get a dollar value of time saved, then compute net monthly savings as (current spend + time-saved value) minus the new plan's price.
- Compute a breakeven point in days by dividing a fixed one-time "switch cost" constant (representing onboarding/migration effort) by the calculated monthly net savings and scaling appropriately — and handle the case where net savings are zero or negative by showing an explicit "N/A" rather than a nonsensical or infinite day count.
- Render a two-segment comparison bar whose fill width is calculated from the actual proportion between the new plan's cost and the combined value (current spend plus time value), clamped so neither segment ever fully disappears regardless of how lopsided the inputs are.
- Show a first-year projection that annualizes the net monthly savings and subtracts the one-time switch cost exactly once (not once per month), and switch its wording between "savings" and "cost" phrasing depending on whether the final number is positive or negative.
- Format every dollar figure with rounding and thousands separators.
Want to tighten it up first? Run this prompt through the AI Prompt Studio to score it across 8 quality dimensions, catch anti-patterns, and tune the wording for Claude, ChatGPT, or Gemini before you paste it in.
Source Code
<div class="rbc-card">
  <div class="rbc-head">
    <h3>See what switching actually saves you</h3>
    <p>Tell us your current setup — we'll calculate your breakeven point and first-year savings.</p>
  </div>

  <div class="rbc-inputs">
    <label class="rbc-field">
      <span>What you spend now <small>per month</small></span>
      <div class="rbc-input-wrap"><span class="rbc-prefix">$</span><input type="number" id="rbcCurrentSpend" value="450" min="0" step="10"></div>
    </label>
    <label class="rbc-field">
      <span>Hours/week on manual work</span>
      <div class="rbc-input-wrap"><input type="number" id="rbcHours" value="6" min="0" step="0.5"><span class="rbc-suffix">hrs</span></div>
    </label>
    <label class="rbc-field">
      <span>Average hourly cost <small>fully loaded</small></span>
      <div class="rbc-input-wrap"><span class="rbc-prefix">$</span><input type="number" id="rbcRate" value="45" min="0" step="5"></div>
    </label>
  </div>

  <div class="rbc-plan">
    <span>Our plan</span>
    <div class="rbc-plan-price">$129<small>/mo</small></div>
  </div>

  <div class="rbc-results" id="rbcResults">
    <div class="rbc-result">
      <span class="rbc-result-label">Time saved value</span>
      <b class="rbc-result-value" id="rbcTimeValue">$0</b>
      <span class="rbc-result-sub">per month, at 70% automation</span>
    </div>
    <div class="rbc-result rbc-result-highlight">
      <span class="rbc-result-label">Net monthly savings</span>
      <b class="rbc-result-value" id="rbcNetSavings">$0</b>
      <span class="rbc-result-sub">vs. your current setup</span>
    </div>
    <div class="rbc-result">
      <span class="rbc-result-label">Breakeven point</span>
      <b class="rbc-result-value" id="rbcBreakeven">Day 0</b>
      <span class="rbc-result-sub">when savings cover the switch</span>
    </div>
  </div>

  <div class="rbc-bar-track">
    <div class="rbc-bar-fill" id="rbcBarFill"></div>
  </div>
  <div class="rbc-bar-labels"><span>Current cost</span><span id="rbcBarLabelRight">Our plan + time saved</span></div>

  <p class="rbc-year" id="rbcYearSavings">Estimated first-year savings: $0</p>
</div>*{box-sizing:border-box;margin:0;padding:0}
body{font-family:system-ui,-apple-system,sans-serif;background:#f5f6fb;display:flex;justify-content:center;padding:40px 20px}
.rbc-card{width:min(460px,96vw);background:#fff;border:1px solid #e7e9f2;border-radius:20px;padding:28px;box-shadow:0 20px 50px rgba(20,20,60,.06)}
.rbc-head h3{font-size:18px;font-weight:800;color:#16182a;margin-bottom:6px}
.rbc-head p{font-size:13px;color:#7b7f99;line-height:1.5;margin-bottom:22px}
.rbc-inputs{display:flex;flex-direction:column;gap:14px;margin-bottom:20px}
.rbc-field{display:flex;flex-direction:column;gap:6px}
.rbc-field span{font-size:12.5px;font-weight:700;color:#3b4156}
.rbc-field small{font-weight:500;color:#9aa0b4}
.rbc-input-wrap{display:flex;align-items:center;border:1.5px solid #e2e3f0;border-radius:10px;overflow:hidden;background:#fafbff}
.rbc-input-wrap:focus-within{border-color:#6366f1}
.rbc-prefix,.rbc-suffix{padding:0 12px;color:#9aa0b4;font-size:14px;font-weight:700}
.rbc-input-wrap input{flex:1;border:none;background:none;padding:10px 4px;font-size:14.5px;font-family:inherit;font-weight:700;color:#16182a;outline:none;min-width:0}
.rbc-input-wrap input:first-child{padding-left:0}
.rbc-plan{display:flex;align-items:center;justify-content:space-between;background:#151726;border-radius:12px;padding:14px 16px;margin-bottom:20px}
.rbc-plan span{font-size:13px;font-weight:700;color:#c7c9e6}
.rbc-plan-price{font-size:18px;font-weight:800;color:#fff}
.rbc-plan-price small{font-size:11px;color:#9698c2;font-weight:600}
.rbc-results{display:grid;grid-template-columns:1fr 1fr 1fr;gap:8px;margin-bottom:18px}
.rbc-result{display:flex;flex-direction:column;gap:4px;padding:12px 10px;border-radius:12px;background:#f7f8fc;text-align:center}
.rbc-result-highlight{background:#eef0fe;border:1.5px solid #c7cbfa}
.rbc-result-label{font-size:10.5px;font-weight:700;color:#7b7f99;text-transform:uppercase;letter-spacing:.02em}
.rbc-result-value{font-size:17px;font-weight:800;color:#16182a}
.rbc-result-highlight .rbc-result-value{color:#4f46e5}
.rbc-result-sub{font-size:9.5px;color:#9aa0b4;line-height:1.3}
.rbc-bar-track{height:10px;border-radius:99px;background:#f97316;overflow:hidden;margin-bottom:6px}
.rbc-bar-fill{height:100%;background:#10b981;width:0%;border-radius:99px 0 0 99px;transition:width .3s ease}
.rbc-bar-labels{display:flex;justify-content:space-between;font-size:10.5px;color:#9aa0b4;font-weight:700;margin-bottom:16px}
.rbc-year{text-align:center;font-size:13.5px;font-weight:700;color:#10b981;background:#ecfdf5;padding:10px;border-radius:10px}
@media(max-width:420px){.rbc-results{grid-template-columns:1fr}}// Every number here is derived live from three inputs — nothing is a static
// placeholder. Changing any input recalculates the full chain: time value ->
// net savings -> breakeven day -> first-year projection -> the savings bar.
var currentSpendInput = document.getElementById('rbcCurrentSpend');
var hoursInput = document.getElementById('rbcHours');
var rateInput = document.getElementById('rbcRate');
var PLAN_PRICE = 129;
var AUTOMATION_RATE = 0.7; // assume the product automates 70% of manual hours
var WEEKS_PER_MONTH = 4.33;
var SWITCH_COST = 300; // one-time onboarding/migration effort, in dollars
var timeValueEl = document.getElementById('rbcTimeValue');
var netSavingsEl = document.getElementById('rbcNetSavings');
var breakevenEl = document.getElementById('rbcBreakeven');
var barFill = document.getElementById('rbcBarFill');
var barLabelRight = document.getElementById('rbcBarLabelRight');
var yearSavingsEl = document.getElementById('rbcYearSavings');
function formatMoney(value) {
return '$' + Math.round(value).toLocaleString();
}
function recalc() {
var currentSpend = Math.max(0, parseFloat(currentSpendInput.value) || 0);
var hoursPerWeek = Math.max(0, parseFloat(hoursInput.value) || 0);
var hourlyRate = Math.max(0, parseFloat(rateInput.value) || 0);
var monthlyHours = hoursPerWeek * WEEKS_PER_MONTH;
var hoursSaved = monthlyHours * AUTOMATION_RATE;
var timeValue = hoursSaved * hourlyRate;
var totalNewCost = PLAN_PRICE; // current spend is fully replaced by the new plan
var netSavings = (currentSpend + timeValue) - totalNewCost;
timeValueEl.textContent = formatMoney(timeValue);
netSavingsEl.textContent = (netSavings >= 0 ? '' : '-') + formatMoney(Math.abs(netSavings));
netSavingsEl.style.color = netSavings >= 0 ? '#10b981' : '#ef4444';
if (netSavings > 0) {
var breakevenDays = Math.ceil((SWITCH_COST / netSavings) * 30);
breakevenEl.textContent = breakevenDays <= 1 ? 'Day 1' : 'Day ' + breakevenDays;
} else {
breakevenEl.textContent = 'N/A';
}
// The bar visualizes new-cost-plus-time-value share of the combined total,
// clamped so a lopsided ratio never fully empties either side.
var combinedTotal = currentSpend + timeValue + totalNewCost;
var newCostShare = combinedTotal > 0 ? (totalNewCost / (currentSpend + timeValue + totalNewCost)) * 100 : 50;
var fillPct = Math.min(92, Math.max(8, 100 - newCostShare));
barFill.style.width = fillPct + '%';
barLabelRight.textContent = 'Our plan ($' + PLAN_PRICE + ') + time saved';
var yearSavings = netSavings * 12 - SWITCH_COST;
yearSavingsEl.textContent = yearSavings >= 0
? 'Estimated first-year savings: ' + formatMoney(yearSavings)
: 'Estimated first-year cost: ' + formatMoney(Math.abs(yearSavings));
}
[currentSpendInput, hoursInput, rateInput].forEach(function (input) {
input.addEventListener('input', recalc);
});
recalc();