

Canary Rollout Progress Tile

Connection Quality Indicator — Signal Bars from Real Network Signals

Job Queue Depth Monitor — Live Backlog Trend with Threshold Alerts
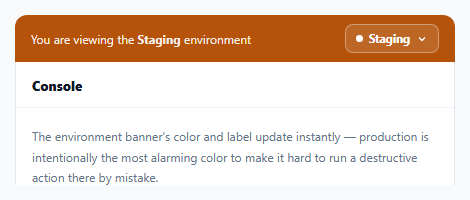
Environment Switcher with Color-Coded Persistent Banner

Admin Impersonation Mode Banner — "Viewing As" with Safe Exit
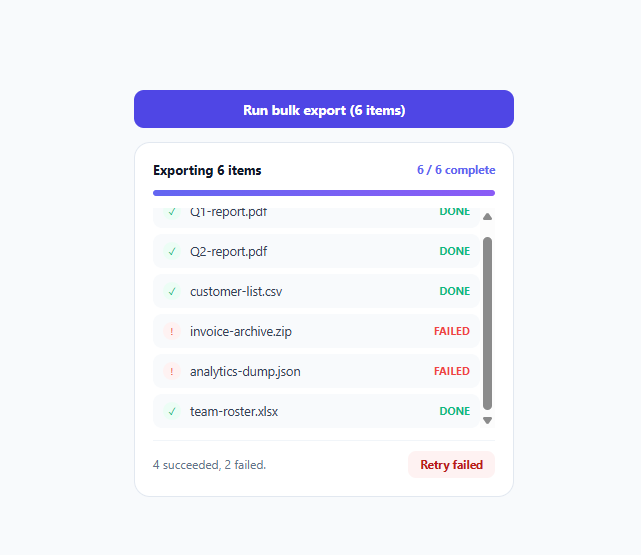
Batch Operation Progress Panel — Per-Item Success/Fail Tracking
Canary Rollout Progress Tile — Free HTML CSS JS Snippet
Canary Rollout Progress Tile · Dashboards · Plain HTML, CSS & JS · Live preview
Copy & paste
Source Code
<div class="demo">
  <div class="tile">
    <div class="tile-head">
      <div class="rel-name">
        <svg width="15" height="15" viewBox="0 0 24 24" fill="none" stroke="currentColor" stroke-width="2.2" stroke-linecap="round" stroke-linejoin="round"><path d="M12 2L2 7l10 5 10-5-10-5z"/><path d="M2 17l10 5 10-5M2 12l10 5 10-5"/></svg>
        <span>checkout-service <b>v2.14.0</b></span>
      </div>
      <span class="badge rolling" id="statusBadge">Rolling out</span>
    </div>

    <div class="stages" id="stages"></div>

    <div class="metrics">
      <div class="metric">
        <span class="m-label">Error rate</span>
        <span class="m-val ok" id="errRate">0.04%</span>
      </div>
      <div class="metric">
        <span class="m-label">p95 latency</span>
        <span class="m-val ok" id="latency">118ms</span>
      </div>
      <div class="metric">
        <span class="m-label">Traffic on canary</span>
        <span class="m-val" id="trafficPct">5%</span>
      </div>
    </div>

    <div class="tile-actions">
      <button class="btn rollback" id="rollbackBtn">Roll back</button>
      <button class="btn promote" id="promoteBtn">Promote now</button>
    </div>
  </div>
</div>
* { box-sizing: border-box; margin: 0; padding: 0; }
body { font-family: system-ui, sans-serif; background: #f8fafc; display: flex; align-items: center; justify-content: center; min-height: 100vh; padding: 24px; }
.tile { width: 400px; max-width: 100%; background: #fff; border: 1px solid #e2e8f0; border-radius: 16px; padding: 20px 22px; display: flex; flex-direction: column; gap: 16px; }
.tile-head { display: flex; align-items: center; justify-content: space-between; }
.rel-name { display: flex; align-items: center; gap: 7px; font-size: 12.5px; color: #475569; font-family: ui-monospace, 'SF Mono', monospace; }
.rel-name svg { color: #6366f1; flex-shrink: 0; }
.rel-name b { color: #0f172a; }
.badge { font-size: 10.5px; font-weight: 800; letter-spacing: 0.03em; padding: 4px 10px; border-radius: 999px; white-space: nowrap; }
.badge.rolling { background: #eef2ff; color: #4f46e5; }
.badge.promoted { background: #dcfce7; color: #15803d; }
.badge.rolledback { background: #fee2e2; color: #dc2626; }
.stages { display: flex; align-items: center; gap: 4px; }
.stage { flex: 1; display: flex; flex-direction: column; align-items: center; gap: 6px; position: relative; }
.stage-dot { width: 22px; height: 22px; border-radius: 50%; background: #f1f5f9; border: 2px solid #e2e8f0; display: flex; align-items: center; justify-content: center; font-size: 10px; font-weight: 800; color: #94a3b8; transition: all 0.25s; z-index: 1; }
.stage.done .stage-dot { background: #6366f1; border-color: #6366f1; color: #fff; }
.stage.active .stage-dot { background: #fff; border-color: #6366f1; color: #6366f1; animation: pulse-ring 1.4s ease-in-out infinite; }
@keyframes pulse-ring { 0%, 100% { box-shadow: 0 0 0 0 rgba(99,102,241,0.35); } 50% { box-shadow: 0 0 0 5px rgba(99,102,241,0); } }
.stage-line { position: absolute; top: 11px; left: 50%; width: 100%; height: 2px; background: #e2e8f0; z-index: 0; }
.stage:last-child .stage-line { display: none; }
.stage.done .stage-line { background: #6366f1; }
.stage-pct { font-size: 10px; font-weight: 700; color: #94a3b8; }
.stage.done .stage-pct, .stage.active .stage-pct { color: #4f46e5; }
.metrics { display: grid; grid-template-columns: repeat(3, 1fr); gap: 10px; padding: 14px 0; border-top: 1px solid #f1f5f9; border-bottom: 1px solid #f1f5f9; }
.metric { display: flex; flex-direction: column; gap: 3px; align-items: center; }
.m-label { font-size: 10.5px; color: #94a3b8; font-weight: 600; text-transform: uppercase; letter-spacing: 0.03em; }
.m-val { font-size: 14px; font-weight: 800; color: #0f172a; font-variant-numeric: tabular-nums; }
.m-val.ok { color: #16a34a; }
.m-val.warn { color: #d97706; }
.m-val.bad { color: #dc2626; }
.tile-actions { display: flex; gap: 10px; }
.btn { flex: 1; padding: 9px; border-radius: 10px; font-size: 12.5px; font-weight: 700; cursor: pointer; transition: opacity 0.12s, background 0.12s; }
.btn.rollback { background: #fff; border: 1px solid #fecaca; color: #dc2626; }
.btn.rollback:hover { background: #fef2f2; }
.btn.promote { background: #0f172a; border: none; color: #fff; }
.btn.promote:hover { opacity: 0.85; }
.btn:disabled { opacity: 0.45; cursor: default; }var STAGES = [5, 25, 50, 100];
var stageIndex = 0;
var status = 'rolling'; // rolling | promoted | rolledback
var stagesEl = document.getElementById('stages');
var badgeEl = document.getElementById('statusBadge');
var trafficEl = document.getElementById('trafficPct');
var errEl = document.getElementById('errRate');
var latEl = document.getElementById('latency');
var rollbackBtn = document.getElementById('rollbackBtn');
var promoteBtn = document.getElementById('promoteBtn');
function renderStages() {
stagesEl.innerHTML = STAGES.map(function (pct, i) {
var cls = i < stageIndex ? 'done' : i === stageIndex && status === 'rolling' ? 'active' : '';
return '<div class="stage ' + cls + '">' +
'<div class="stage-dot">' + (i < stageIndex ? '\u2713' : (i + 1)) + '<div class="stage-line"></div></div>' +
'<span class="stage-pct">' + pct + '%</span>' +
'</div>';
}).join('');
}
function randomBetween(min, max) { return Math.round((Math.random() * (max - min) + min) * 100) / 100; }
function refreshMetrics() {
var err = randomBetween(0.02, 0.09);
var lat = Math.round(randomBetween(105, 135));
errEl.textContent = err + '%';
errEl.className = 'm-val ' + (err > 0.08 ? 'bad' : err > 0.05 ? 'warn' : 'ok');
latEl.textContent = lat + 'ms';
latEl.className = 'm-val ' + (lat > 130 ? 'bad' : lat > 120 ? 'warn' : 'ok');
trafficEl.textContent = STAGES[Math.min(stageIndex, STAGES.length - 1)] + '%';
}
function setStatus(next) {
status = next;
badgeEl.className = 'badge ' + (next === 'promoted' ? 'promoted' : next === 'rolledback' ? 'rolledback' : 'rolling');
badgeEl.textContent = next === 'promoted' ? 'Promoted' : next === 'rolledback' ? 'Rolled back' : 'Rolling out';
rollbackBtn.disabled = next !== 'rolling';
promoteBtn.disabled = next !== 'rolling';
if (next !== 'rolling') { promoteBtn.textContent = next === 'promoted' ? 'Promoted to 100%' : 'Rollback complete'; }
}
function advance() {
if (status !== 'rolling') return;
if (stageIndex < STAGES.length - 1) {
stageIndex++;
renderStages();
refreshMetrics();
} else {
setStatus('promoted');
}
}
rollbackBtn.addEventListener('click', function () { setStatus('rolledback'); });
promoteBtn.addEventListener('click', function () { stageIndex = STAGES.length - 1; renderStages(); setStatus('promoted'); });
renderStages();
refreshMetrics();
var autoAdvance = setInterval(function () {
if (status !== 'rolling') { clearInterval(autoAdvance); return; }
advance();
}, 4000);Extend with AI
Take This Snippet Further With AI
The AI prompt for this one is for Patreon supporters ($3 a month, 7 days free), along with a site with no ads. Supporters enter the passcode once and it is remembered in this browser.
What's included
Features
About this UI Snippet
Canary Rollout Progress Tile — Staged Traffic, Guardrail Metrics & Promote/Rollback
A canary rollout ships a new version to a small slice of traffic first, watches health metrics, then gradually increases that slice — the opposite of an all-at-once deploy. This tile visualizes exactly that: a staged progress track (5% → 25% → 50% → 100% of traffic), live guardrail metrics (error rate and p95 latency) that would justify continuing or aborting, and explicit promote/rollback controls, all wired to one small state machine.
The stage track models discrete steps, not a continuous bar
Unlike a generic progress bar, STAGES is an explicit array of traffic percentages, and stageIndex is an integer pointing at the current one. renderStages() marks every stage before stageIndex as .done (filled, checkmark), the current one as .active (pulsing ring animation via a box-shadow keyframe), and later ones as neutral. This matters because a real canary rollout doesn't move continuously — it holds at each traffic percentage for an observation window before deciding to advance, so a discrete stepped track communicates the actual deployment model more honestly than a smooth 0–100% bar would.
Guardrail metrics colored independently of rollout status
errEl and latEl get their own ok/warn/bad class based on fixed thresholds (refreshMetrics()), completely independent of whether the rollout badge currently says "Rolling out" or "Promoted." This separation is intentional — in a real system, these are exactly the numbers an automated canary analysis tool (or an on-call engineer) would watch to decide *whether* to let the rollout advance, so they need to be legible as their own signal rather than folded into a single combined status.
Promote and rollback as explicit terminal actions
Clicking "Promote now" jumps stageIndex straight to the final stage and calls setStatus('promoted'); clicking "Roll back" calls setStatus('rolledback') without touching stageIndex at all — deliberately, since a rollback's whole point is to stop admitting more traffic to the new version, not to pretend the rollout continued. Both actions disable further stage auto-advancement and both buttons, because a canary rollout has exactly one live decision point at a time; once promoted or rolled back, the only next action is starting an entirely new rollout.
The auto-advance timer as a stand-in for a bake-time scheduler
setInterval(advance, 4000) simulates the automatic stage-advancement a real canary pipeline (Argo Rollouts, Flagger, or a custom deployment controller) would run on a bake-time schedule, typically minutes to hours per stage rather than seconds. Swap the interval callback for a webhook or polling call to your actual deployment orchestrator's status API, and the same renderStages()/refreshMetrics() functions apply the real state.
Step by step
How to Use
- 1Watch it auto-advanceThe tile auto-advances through traffic stages every 4 seconds in the demo — refreshing error rate and latency metrics at each stage.
- 2Click Roll backImmediately halts the rollout at its current stage and switches the badge to a rolled-back state, disabling further actions.
- 3Click Promote nowJumps straight to the final 100% stage and marks the release as fully promoted.
- 4Edit the STAGES arrayChange the traffic percentages and number of stages to match your own canary pipeline's configuration.
- 5Adjust guardrail thresholdsEdit the error-rate and latency cutoffs inside refreshMetrics() to match your service's actual SLOs.
- 6Connect a real deployment APIReplace the setInterval simulation with polling or a webhook from your deployment orchestrator (Argo Rollouts, Flagger, or similar) that updates stageIndex and the metric values.
Real-world uses
Common Use Cases
Got questions?
Frequently Asked Questions
The stage track is a fixed set of discrete traffic-percentage steps (STAGES), not a continuously animating fill. Each stage renders as its own dot marked done, active, or pending, because a real canary rollout holds at each percentage for an observation window rather than moving smoothly — a stepped track communicates that model more accurately.
errEl and latEl are colored ok/warn/bad from fixed numeric thresholds inside refreshMetrics(), entirely independent of the rolling/promoted/rolledback badge state. This mirrors how a real canary analysis works: the metrics are the signal used to decide whether to let the rollout continue, so they need to be readable on their own rather than folded into the overall status.
Nothing — rollback intentionally leaves stageIndex untouched, since the point of a rollback is to stop the rollout at whatever traffic percentage it had reached, not to pretend progress continued. Only the status and badge change, and both buttons become disabled.
No — it sets stageIndex directly to the last entry in STAGES and calls setStatus("promoted") immediately, modeling a manual "just ship it to 100%" override rather than requiring the auto-advance timer to step through every stage first.
Replace the setInterval(advance, 4000) simulation with a polling call (or webhook handler) against your deployment orchestrator's status API, updating stageIndex and calling refreshMetrics() with real error-rate and latency values whenever the orchestrator reports a stage change.
Yes — STAGES is a plain array of traffic percentages; add, remove, or change entries and the stage track, traffic-on-canary readout, and stage count all adjust automatically since everything derives from STAGES.length and STAGES[stageIndex].