

Interact.js Draggable and Resizable Dashboard Panels with Snapping
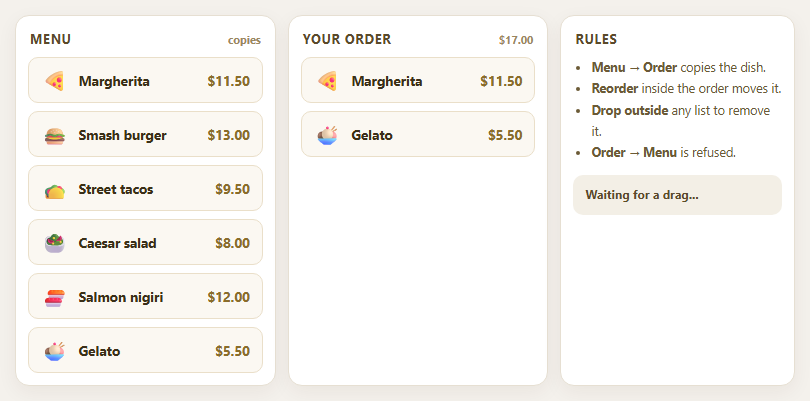
Dragula Copy vs Move Lists with Spill Control

SortableJS Shared Groups: Clone from a Palette into a Page Builder

SortableJS Drag Handle with Pinned and Locked Rows
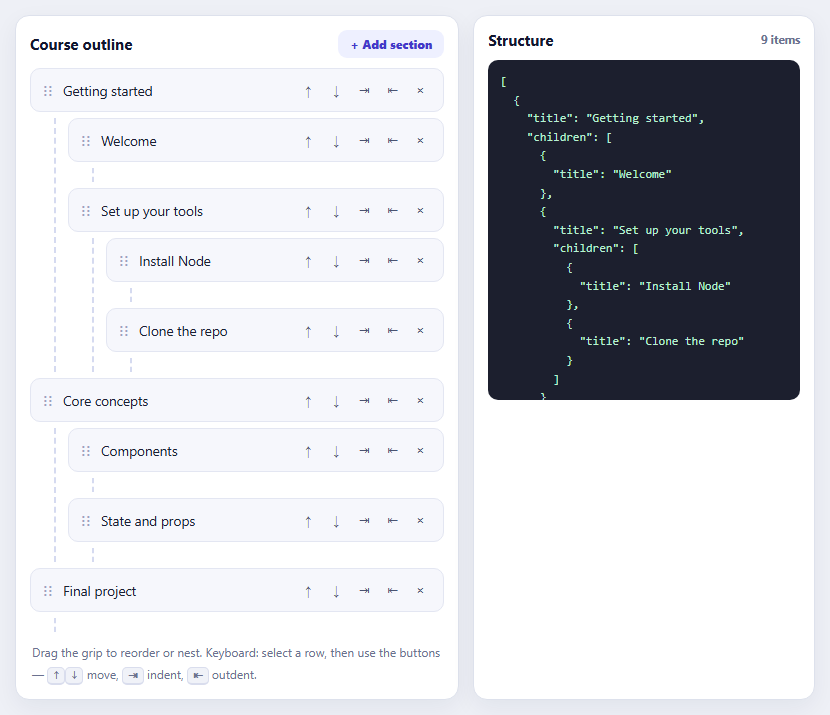
SortableJS Nested Sortable Tree with Keyboard Controls
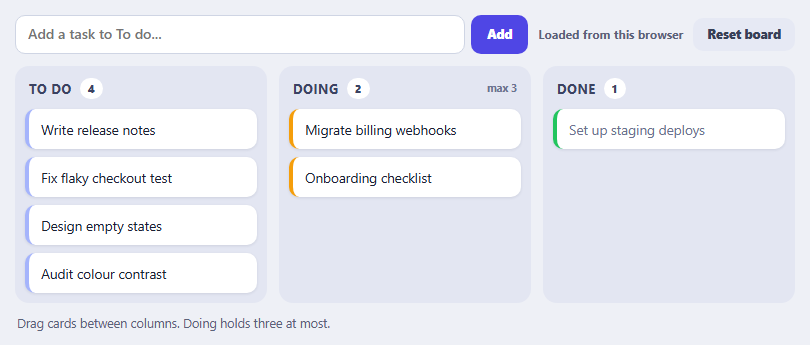
SortableJS Multi-List Kanban with Persistence and WIP Limit
Metric KPI Card Grid — Animated Dashboard Cards HTML CSS JS
Metric KPI Card Grid · Dashboards · Plain HTML, CSS & JS · Live preview
Copy & paste
Source Code
<div class="page">
  <header class="page-header">
    <div>
      <h1 class="page-title">Overview</h1>
      <p class="page-sub"><span class="live-dot" aria-hidden="true"></span><span id="periodLabel">Last 30 days</span> · Updated just now</p>
    </div>
    <div class="period-toggle" role="group" aria-label="Time period" style="--i:0">
      <span class="pt-ind" aria-hidden="true"></span>
      <button class="pt-btn active" type="button" data-period="30d" aria-pressed="true">30d</button>
      <button class="pt-btn" type="button" data-period="7d" aria-pressed="false">7d</button>
      <button class="pt-btn" type="button" data-period="1d" aria-pressed="false">24h</button>
    </div>
  </header>

  <section class="metric-grid" aria-label="Key metrics">
    <article class="metric-card" data-key="users" style="--c:#6366f1;--ct:rgba(99,102,241,.14);--n:0">
      <div class="metric-top">
        <div class="metric-icon">
          <svg width="18" height="18" viewBox="0 0 24 24" fill="none" stroke="currentColor" stroke-width="2" stroke-linecap="round" stroke-linejoin="round" aria-hidden="true"><path d="M17 21v-2a4 4 0 0 0-4-4H5a4 4 0 0 0-4 4v2"/><circle cx="9" cy="7" r="4"/><path d="M23 21v-2a4 4 0 0 0-3-3.87"/><path d="M16 3.13a4 4 0 0 1 0 7.75"/></svg>
        </div>
        <span class="trend up"><span class="trend-arrow" aria-hidden="true">↑</span><span class="trend-val">12.5%</span></span>
      </div>
      <div class="metric-val">24,531</div>
      <div class="metric-label">Total Users</div>
      <div class="spark"></div>
    </article>

    <article class="metric-card" data-key="revenue" style="--c:#10b981;--ct:rgba(16,185,129,.14);--n:1">
      <div class="metric-top">
        <div class="metric-icon">
          <svg width="18" height="18" viewBox="0 0 24 24" fill="none" stroke="currentColor" stroke-width="2" stroke-linecap="round" stroke-linejoin="round" aria-hidden="true"><line x1="12" y1="1" x2="12" y2="23"/><path d="M17 5H9.5a3.5 3.5 0 0 0 0 7h5a3.5 3.5 0 0 1 0 7H6"/></svg>
        </div>
        <span class="trend up"><span class="trend-arrow" aria-hidden="true">↑</span><span class="trend-val">8.2%</span></span>
      </div>
      <div class="metric-val">$48,290</div>
      <div class="metric-label">Monthly Revenue</div>
      <div class="spark"></div>
    </article>

    <article class="metric-card" data-key="session" style="--c:#f59e0b;--ct:rgba(245,158,11,.16);--n:2">
      <div class="metric-top">
        <div class="metric-icon">
          <svg width="18" height="18" viewBox="0 0 24 24" fill="none" stroke="currentColor" stroke-width="2" stroke-linecap="round" stroke-linejoin="round" aria-hidden="true"><polyline points="22 12 18 12 15 21 9 3 6 12 2 12"/></svg>
        </div>
        <span class="trend down"><span class="trend-arrow" aria-hidden="true">↓</span><span class="trend-val">2.1%</span></span>
      </div>
      <div class="metric-val">3m 42s</div>
      <div class="metric-label">Avg. Session</div>
      <div class="spark"></div>
    </article>

    <article class="metric-card" data-key="conv" style="--c:#a855f7;--ct:rgba(168,85,247,.14);--n:3">
      <div class="metric-top">
        <div class="metric-icon">
          <svg width="18" height="18" viewBox="0 0 24 24" fill="none" stroke="currentColor" stroke-width="2" stroke-linecap="round" stroke-linejoin="round" aria-hidden="true"><path d="M22 11.08V12a10 10 0 1 1-5.93-9.14"/><polyline points="22 4 12 14.01 9 11.01"/></svg>
        </div>
        <span class="trend up"><span class="trend-arrow" aria-hidden="true">↑</span><span class="trend-val">4.7%</span></span>
      </div>
      <div class="metric-val">73.4%</div>
      <div class="metric-label">Conversion Rate</div>
      <div class="spark"></div>
    </article>
  </section>

  <section class="breakdown-row">
    <div class="breakdown-card">
      <h3 class="breakdown-title">Top Channels</h3>
      <div class="channel-list">
        <div class="channel-item">
          <span class="ch-name"><i style="background:#6366f1"></i>Organic Search</span>
          <div class="ch-bar-wrap"><div class="ch-bar" style="background:#6366f1"></div></div>
          <span class="ch-pct">68%</span>
        </div>
        <div class="channel-item">
          <span class="ch-name"><i style="background:#10b981"></i>Direct</span>
          <div class="ch-bar-wrap"><div class="ch-bar" style="background:#10b981"></div></div>
          <span class="ch-pct">22%</span>
        </div>
        <div class="channel-item">
          <span class="ch-name"><i style="background:#f59e0b"></i>Social</span>
          <div class="ch-bar-wrap"><div class="ch-bar" style="background:#f59e0b"></div></div>
          <span class="ch-pct">10%</span>
        </div>
      </div>
    </div>
    <div class="breakdown-card">
      <h3 class="breakdown-title">Goal Progress</h3>
      <div class="goals">
        <div class="goal-item">
          <div class="goal-head"><span>Revenue target</span><span class="goal-pct">82%</span></div>
          <div class="goal-track"><div class="goal-fill" style="background:linear-gradient(90deg,#6366f1,#8b5cf6)"></div></div>
        </div>
        <div class="goal-item">
          <div class="goal-head"><span>User growth</span><span class="goal-pct">91%</span></div>
          <div class="goal-track"><div class="goal-fill" style="background:linear-gradient(90deg,#10b981,#059669)"></div></div>
        </div>
        <div class="goal-item">
          <div class="goal-head"><span>Churn reduction</span><span class="goal-pct">44%</span></div>
          <div class="goal-track"><div class="goal-fill" style="background:linear-gradient(90deg,#f59e0b,#ef4444)"></div></div>
        </div>
      </div>
    </div>
  </section>
</div>*{box-sizing:border-box;margin:0;padding:0}
:root{--bg:#f4f6fb;--card:#fff;--line:#e5e9f2;--ink:#0f172a;--ink2:#475569;--ink3:#94a3b8;--track:#eef1f7;--accent:#6366f1;--shadow:0 1px 2px rgba(15,23,42,.04),0 8px 24px -12px rgba(15,23,42,.12);--up-fg:#047857;--up-bg:#d1fae5;--dn-fg:#b91c1c;--dn-bg:#fee2e2;--tip:#0f172a;--tip-fg:#fff}
@media(prefers-color-scheme:dark){:root{--bg:#0b1020;--card:#131a2e;--line:#232c46;--ink:#f1f5f9;--ink2:#a5b0c8;--ink3:#6b7794;--track:#1d2640;--shadow:0 1px 2px rgba(0,0,0,.3),0 12px 28px -14px rgba(0,0,0,.6);--up-fg:#6ee7b7;--up-bg:rgba(16,185,129,.16);--dn-fg:#fca5a5;--dn-bg:rgba(239,68,68,.18);--tip:#f1f5f9;--tip-fg:#0f172a}}
body{font-family:system-ui,-apple-system,'Segoe UI',sans-serif;background:var(--bg);color:var(--ink);min-height:100vh;padding:28px 20px}
.page{max-width:900px;margin:0 auto;display:flex;flex-direction:column;gap:20px}
.page-header{display:flex;align-items:flex-start;justify-content:space-between;gap:12px;flex-wrap:wrap}
.page-title{font-size:24px;font-weight:800;letter-spacing:-.02em}
.page-sub{font-size:12.5px;color:var(--ink3);margin-top:4px;display:flex;align-items:center;gap:7px}
.live-dot{width:7px;height:7px;border-radius:50%;background:#10b981;box-shadow:0 0 0 0 rgba(16,185,129,.5);animation:pulse 2s infinite}
@keyframes pulse{70%{box-shadow:0 0 0 7px rgba(16,185,129,0)}100%{box-shadow:0 0 0 0 rgba(16,185,129,0)}}
.period-toggle{position:relative;display:grid;grid-template-columns:repeat(3,1fr);background:var(--card);border:1px solid var(--line);border-radius:12px;padding:3px;flex-shrink:0;box-shadow:var(--shadow)}
.pt-ind{position:absolute;top:3px;bottom:3px;left:3px;width:calc((100% - 6px)/3);border-radius:9px;background:var(--accent);transform:translateX(calc(var(--i)*100%));transition:transform .35s cubic-bezier(.3,1.3,.5,1);box-shadow:0 4px 12px -3px rgba(99,102,241,.55)}
.pt-btn{position:relative;z-index:1;min-width:48px;padding:6px 14px;font-size:12.5px;font-weight:600;color:var(--ink2);background:none;border:none;border-radius:9px;cursor:pointer;transition:color .2s;font-family:inherit}
.pt-btn.active{color:#fff}
.pt-btn:not(.active):hover{color:var(--ink)}
.pt-btn:focus-visible{outline:2px solid var(--accent);outline-offset:2px}
.metric-grid{display:grid;grid-template-columns:repeat(4,1fr);gap:14px}
.metric-card{position:relative;background:var(--card);border:1px solid var(--line);border-radius:16px;padding:16px 16px 12px;box-shadow:var(--shadow);overflow:hidden;transition:transform .25s,border-color .25s;animation:rise .55s cubic-bezier(.2,.8,.2,1) both;animation-delay:calc(var(--n)*70ms)}
.metric-card::before{content:'';position:absolute;inset:0;background:radial-gradient(180px circle at var(--mx,50%) var(--my,0%),var(--ct),transparent 70%);opacity:0;transition:opacity .3s;pointer-events:none}
.metric-card:hover{transform:translateY(-3px);border-color:var(--c)}
.metric-card:hover::before{opacity:1}
@keyframes rise{from{opacity:0;transform:translateY(14px)}to{opacity:1;transform:none}}
.metric-top{position:relative;display:flex;align-items:center;justify-content:space-between;margin-bottom:14px}
.metric-icon{width:36px;height:36px;border-radius:11px;background:var(--ct);color:var(--c);display:flex;align-items:center;justify-content:center}
.trend{display:inline-flex;align-items:center;gap:3px;font-size:11.5px;font-weight:700;padding:3px 8px;border-radius:999px;font-variant-numeric:tabular-nums}
.trend.good{color:var(--up-fg);background:var(--up-bg)}
.trend.bad{color:var(--dn-fg);background:var(--dn-bg)}
.trend.up:not(.good):not(.bad){color:var(--up-fg);background:var(--up-bg)}
.trend.down:not(.good):not(.bad){color:var(--dn-fg);background:var(--dn-bg)}
.trend-arrow{display:inline-block;transition:transform .3s}
.metric-val{position:relative;font-size:26px;font-weight:800;letter-spacing:-.025em;line-height:1;font-variant-numeric:tabular-nums}
.metric-label{position:relative;font-size:12px;color:var(--ink2);font-weight:500;margin:6px 0 10px}
.spark{position:relative;height:46px;margin:0 -4px;cursor:crosshair;touch-action:pan-y}
.spark svg{display:block;width:100%;height:100%;overflow:visible}
.spark-line{fill:none;stroke:var(--c);stroke-width:2;stroke-linecap:round;stroke-linejoin:round;vector-effect:non-scaling-stroke}
.spark.draw svg{animation:reveal .9s cubic-bezier(.4,0,.2,1) both}
@keyframes reveal{from{clip-path:inset(-8px 100% -8px 0)}to{clip-path:inset(-8px -8px -8px -8px)}}
.spark-dot{position:absolute;width:10px;height:10px;margin:-5px 0 0 -5px;border-radius:50%;background:var(--card);border:2.5px solid var(--c);pointer-events:none;opacity:0;transition:opacity .15s;box-shadow:0 0 0 4px var(--ct)}
.spark-cross{position:absolute;top:0;bottom:0;width:1px;background:var(--c);opacity:0;pointer-events:none;transition:opacity .15s}
.spark-tip{position:absolute;bottom:calc(100% + 6px);transform:translateX(-50%);background:var(--tip);color:var(--tip-fg);font-size:11px;font-weight:600;padding:4px 8px;border-radius:7px;white-space:nowrap;pointer-events:none;opacity:0;transition:opacity .15s;z-index:3;font-variant-numeric:tabular-nums}
.spark-tip small{opacity:.65;font-weight:500;margin-right:5px}
.spark.on .spark-dot,.spark.on .spark-cross,.spark.on .spark-tip{opacity:1}
.breakdown-row{display:grid;grid-template-columns:1fr 1fr;gap:14px}
.breakdown-card{background:var(--card);border:1px solid var(--line);border-radius:16px;padding:20px;box-shadow:var(--shadow);animation:rise .55s cubic-bezier(.2,.8,.2,1) .35s both}
.breakdown-title{font-size:13.5px;font-weight:700;margin-bottom:16px}
.channel-list{display:flex;flex-direction:column;gap:13px}
.channel-item{display:grid;grid-template-columns:118px 1fr 38px;align-items:center;gap:10px}
.ch-name{display:flex;align-items:center;gap:7px;font-size:12.5px;color:var(--ink2);font-weight:500;white-space:nowrap}
.ch-name i{width:8px;height:8px;border-radius:3px;flex-shrink:0}
.ch-bar-wrap{background:var(--track);border-radius:6px;height:8px;overflow:hidden}
.ch-bar{height:100%;width:0;border-radius:6px;transition:width .9s cubic-bezier(.3,.9,.3,1)}
.ch-pct{font-size:12px;font-weight:700;color:var(--ink);text-align:right;font-variant-numeric:tabular-nums}
.goals{display:flex;flex-direction:column;gap:15px}
.goal-item{display:flex;flex-direction:column;gap:7px}
.goal-head{display:flex;justify-content:space-between;font-size:12.5px;color:var(--ink2);font-weight:500}
.goal-pct{font-weight:700;color:var(--ink);font-variant-numeric:tabular-nums}
.goal-track{background:var(--track);border-radius:8px;height:9px;overflow:hidden}
.goal-fill{height:100%;width:0;border-radius:8px;transition:width 1s cubic-bezier(.3,.9,.3,1)}
@media(max-width:820px){.metric-grid{grid-template-columns:repeat(2,1fr)}}
@media(max-width:620px){.breakdown-row{grid-template-columns:1fr}.metric-val{font-size:23px}}
@media(max-width:380px){.metric-grid{grid-template-columns:1fr}.channel-item{grid-template-columns:100px 1fr 36px}}
@media(prefers-reduced-motion:reduce){*,*::before,*::after{animation:none!important;transition-duration:.01ms!important}}// One object per period. Each metric has: v (value), t (signed % change vs the previous period),
// d (sparkline points). Swap this for your API response.
var PERIODS = {
'30d': { label: 'Last 30 days', unit: 'Day', step: 30 / 12,
users: { v: 24531, t: 12.5, d: [40,55,45,60,52,68,58,72,65,80,70,88] },
revenue: { v: 48290, t: 8.2, d: [30,40,35,55,48,62,50,72,60,78,68,82] },
session: { v: 222, t: -2.1, d: [70,65,72,60,68,55,62,50,58,45,52,48] },
conv: { v: 73.4, t: 4.7, d: [45,50,48,60,55,65,58,70,62,68,65,73] },
channels: [68, 22, 10], goals: [82, 91, 44] },
'7d': { label: 'Last 7 days', unit: 'Day', step: 1,
users: { v: 6120, t: 3.4, d: [52,58,55,64,61,70,76] },
revenue: { v: 11840, t: -1.6, d: [60,66,58,72,64,61,63] },
session: { v: 236, t: 1.8, d: [44,50,47,55,58,54,62] },
conv: { v: 71.9, t: 0.9, d: [60,62,61,66,64,68,69] },
channels: [61, 27, 12], goals: [64, 78, 39] },
'1d': { label: 'Last 24 hours', unit: 'Hour', step: 2,
users: { v: 874, t: -0.8, d: [20,14,10,18,34,52,66,72,64,58,48,40] },
revenue: { v: 1630, t: 5.3, d: [12,10,8,14,26,40,52,68,60,64,70,76] },
session: { v: 208, t: -4.2, d: [66,60,58,54,50,52,46,48,44,40,42,38] },
conv: { v: 70.2, t: 2.2, d: [50,52,51,55,58,60,57,63,62,66,64,68] },
channels: [54, 31, 15], goals: [31, 40, 22] }
};
// fmt formats a number; lowerIsBetter flips which direction is coloured green (e.g. churn, load time)
var METRICS = {
users: { fmt: function (n) { return Math.round(n).toLocaleString('en-US'); } },
revenue: { fmt: function (n) { return '$' + Math.round(n).toLocaleString('en-US'); } },
session: { fmt: function (n) { n = Math.round(n); return Math.floor(n / 60) + 'm ' + String(n % 60).padStart(2, '0') + 's'; } },
conv: { fmt: function (n) { return n.toFixed(1) + '%'; } }
};
var reduce = window.matchMedia && matchMedia('(prefers-reduced-motion: reduce)').matches;
var current = '30d';
var state = {}; // last rendered number per element, so counts animate from where they were
function ease(t) { return 1 - Math.pow(1 - t, 3); }
function countTo(el, to, fmt, key) {
var from = state[key] == null ? 0 : state[key];
state[key] = to;
if (reduce) { el.textContent = fmt(to); return; }
var start = null, dur = 900;
el._raf && cancelAnimationFrame(el._raf);
function frame(ts) {
if (start === null) start = ts;
var p = Math.min((ts - start) / dur, 1);
el.textContent = fmt(from + (to - from) * ease(p));
if (p < 1) el._raf = requestAnimationFrame(frame);
}
el._raf = requestAnimationFrame(frame);
}
// Catmull-Rom spline through the points, converted to cubic Béziers
function curve(p) {
var d = 'M' + p[0][0] + ',' + p[0][1];
for (var i = 0; i < p.length - 1; i++) {
var p0 = p[i - 1] || p[i], p1 = p[i], p2 = p[i + 1], p3 = p[i + 2] || p2;
d += ' C' + (p1[0] + (p2[0] - p0[0]) / 6).toFixed(2) + ',' + (p1[1] + (p2[1] - p0[1]) / 6).toFixed(2) +
' ' + (p2[0] - (p3[0] - p1[0]) / 6).toFixed(2) + ',' + (p2[1] - (p3[1] - p1[1]) / 6).toFixed(2) +
' ' + p2[0] + ',' + p2[1];
}
return d;
}
function drawSpark(card, key, data) {
var box = card.querySelector('.spark');
var min = Math.min.apply(null, data), max = Math.max.apply(null, data), rng = (max - min) || 1;
var pts = data.map(function (v, i) {
return [+(i / (data.length - 1) * 120).toFixed(2), +(4 + (1 - (v - min) / rng) * 32).toFixed(2)];
});
var line = curve(pts);
var id = 'sg-' + key;
box.innerHTML =
'<svg viewBox="0 0 120 40" preserveAspectRatio="none" aria-hidden="true">' +
'<defs><linearGradient id="' + id + '" x1="0" y1="0" x2="0" y2="1"><stop offset="0" stop-color="var(--c)" stop-opacity=".28"/><stop offset="1" stop-color="var(--c)" stop-opacity="0"/></linearGradient></defs>' +
'<path class="spark-area" d="' + line + ' L120,40 L0,40 Z" fill="url(#' + id + ')"/>' +
'<path class="spark-line" d="' + line + '"/></svg>' +
'<span class="spark-cross"></span><span class="spark-dot"></span><span class="spark-tip"></span>';
box._pts = pts; box._data = data; box._key = key;
box.classList.remove('draw'); void box.offsetWidth; box.classList.add('draw');
}
// Hover / touch: snap to the nearest point, show a dot, crosshair and value tooltip
document.querySelectorAll('.spark').forEach(function (box) {
function move(e) {
if (!box._pts) return;
var r = box.getBoundingClientRect();
var i = Math.round(Math.min(Math.max((e.clientX - r.left) / r.width, 0), 1) * (box._data.length - 1));
var pt = box._pts[i], per = PERIODS[current];
var x = pt[0] / 120 * 100, y = pt[1] / 40 * 100;
var dot = box.querySelector('.spark-dot'), tip = box.querySelector('.spark-tip'), cr = box.querySelector('.spark-cross');
dot.style.left = x + '%'; dot.style.top = y + '%';
cr.style.left = x + '%';
tip.style.left = Math.min(Math.max(x, 22), 78) + '%';
var real = per[box._key].v * (box._data[i] / box._data[box._data.length - 1]);
tip.innerHTML = '<small>' + per.unit + ' ' + Math.round((i + 1) * per.step) + '</small>' + METRICS[box._key].fmt(real);
box.classList.add('on');
}
box.addEventListener('pointermove', move);
box.addEventListener('pointerdown', move);
box.addEventListener('pointerleave', function () { box.classList.remove('on'); });
});
// Soft spotlight that follows the cursor inside each card
document.querySelectorAll('.metric-card').forEach(function (card) {
card.addEventListener('pointermove', function (e) {
var r = card.getBoundingClientRect();
card.style.setProperty('--mx', (e.clientX - r.left) + 'px');
card.style.setProperty('--my', (e.clientY - r.top) + 'px');
});
});
function render(period) {
var per = PERIODS[period];
document.getElementById('periodLabel').textContent = per.label;
document.querySelectorAll('.metric-card').forEach(function (card) {
var key = card.dataset.key, m = per[key];
countTo(card.querySelector('.metric-val'), m.v, METRICS[key].fmt, key);
drawSpark(card, key, m.d);
var up = m.t >= 0;
var good = METRICS[key].lowerIsBetter ? !up : up; // is this change good news?
var badge = card.querySelector('.trend');
badge.className = 'trend ' + (up ? 'up' : 'down') + ' ' + (good ? 'good' : 'bad');
badge.querySelector('.trend-arrow').textContent = up ? '↑' : '↓';
badge.querySelector('.trend-val').textContent = Math.abs(m.t).toFixed(1) + '%';
badge.setAttribute('aria-label', (up ? 'Up ' : 'Down ') + Math.abs(m.t).toFixed(1) + ' percent');
});
document.querySelectorAll('.ch-bar').forEach(function (bar, i) {
bar.style.width = per.channels[i] + '%';
countTo(bar.parentNode.nextElementSibling, per.channels[i], function (n) { return Math.round(n) + '%'; }, 'ch' + i);
});
document.querySelectorAll('.goal-fill').forEach(function (bar, i) {
bar.style.width = per.goals[i] + '%';
countTo(bar.parentNode.previousElementSibling.lastElementChild, per.goals[i], function (n) { return Math.round(n) + '%'; }, 'g' + i);
});
}
var toggle = document.querySelector('.period-toggle');
var btns = Array.prototype.slice.call(document.querySelectorAll('.pt-btn'));
btns.forEach(function (btn, i) {
btn.addEventListener('click', function () {
if (btn.dataset.period === current) return;
current = btn.dataset.period;
btns.forEach(function (b) { b.classList.toggle('active', b === btn); b.setAttribute('aria-pressed', b === btn); });
toggle.style.setProperty('--i', i);
render(current);
});
});
render(current);Extend with AI
Take This Snippet Further With AI
The AI prompt for this one is for Patreon supporters ($3 a month, 7 days free), along with a site with no ads. Supporters enter the passcode once and it is remembered in this browser.
What's included
Features
lowerIsBetter flag so a falling churn rate is green and a falling revenue is red. Includes an aria-label.prefers-color-scheme: dark override, so the dashboard follows the visitor's system theme automatically.About this UI Snippet
Metric KPI Card Grid — Smooth Sparklines, Count-Up Numbers & Dashboard Layout Pattern
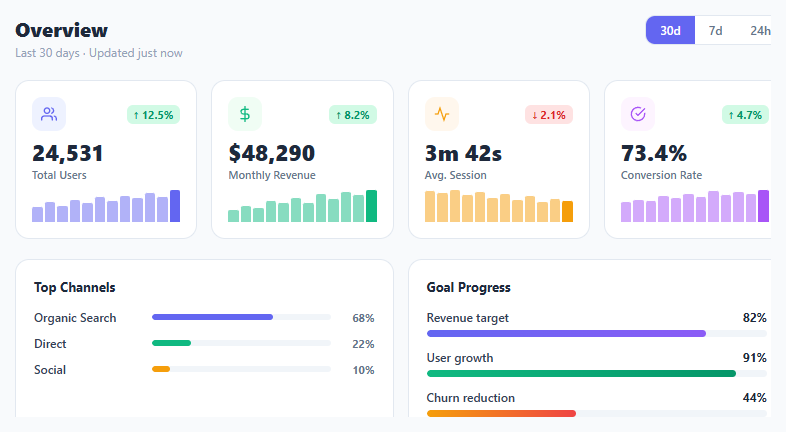
KPI metric cards are the centrepiece of every analytics dashboard — they surface the numbers that matter most and show direction (up, down, flat) at a glance. This snippet builds a complete dashboard overview: four metric cards with count-up values, smooth SVG area sparklines you can hover for exact values, good/bad-aware trend badges, a sliding period toggle that really swaps the data, and two breakdown panels (channel share and goal progress) whose bars animate to their new widths. It follows the system light/dark preference with no extra code.
The design challenge is information density. Each card has to carry a value, a direction, the size of the change and a trend over time without feeling crowded. The icon tile, trend pill and sparkline each add one signal layer, and the big tabular-number value stays the loudest thing on the card.
Smooth sparklines from one data array
Every card's sparkline is generated from a plain array in the PERIODS object. The script normalises the points between that series' own min and max, converts them to a Catmull-Rom spline (a series of cubic Bézier curves) and draws it as an SVG path with a soft gradient area underneath. The SVG uses preserveAspectRatio="none" so it stretches to any card width, and vector-effect: non-scaling-stroke keeps the line a constant 2px instead of getting squashed. On every redraw the chart wipes in from left to right with an animated clip-path.
Hover, touch and tooltips without a library
A single pointermove handler maps the cursor's x position to the nearest data index, then moves an HTML dot, a crosshair line and a tooltip to that point. The dot and tooltip are normal elements positioned by percentage, so they stay perfectly round even though the SVG underneath is stretched. Because it uses pointer events, the same code works for mouse, pen and touch.
Count-up values and a working period toggle
Switching 30d / 7d / 24h doesn't just move a highlight — render() reads the new period's data, counts every number from its previous value to the new one with requestAnimationFrame and an ease-out curve, redraws the sparklines and animates the breakdown bars to their new widths. The active pill is a single absolutely positioned element that slides using a --i custom property, so the motion is one CSS transform — the same idea as the segmented control, and the count-up follows the number ticker approach.
Trend badges that know good from bad
A trend badge combines an arrow, the percentage and a tinted background, so direction never relies on colour alone, and it carries an aria-label for screen readers. Direction and meaning are separate: the badge class is up/down from the sign, then good/bad from the metric's lowerIsBetter flag. A falling churn rate or page load time can therefore show a down arrow in green, while a falling session length shows a down arrow in red.
Theming and motion
All colours are CSS variables defined on :root with a prefers-color-scheme: dark override, and each card receives its accent through --c and --ct. Cards fade up with a staggered delay, a soft spotlight follows the cursor, and prefers-reduced-motion switches the animations off and shows final values immediately.
Need a bigger chart than a sparkline? Pair the grid with an area chart or a standalone sparkline chart, show goal health with a donut progress ring, or build a full draggable layout from the dashboard widget grid.
Step by step
How to Use
- 1Paste HTML, CSS, and JSFour KPI cards fade in with counting values and wipe-in sparklines. Below them sit a channel breakdown and goal progress panel whose bars animate to their values.
- 2Read the metric cardsTotal Users (↑12.5%), Monthly Revenue (↑8.2%), Avg. Session (↓2.1%, shown red because shorter sessions are bad) and Conversion Rate (↑4.7%). Each card includes a spline sparkline of the period's trend.
- 3Hover or touch a sparklineA dot and crosshair snap to the nearest data point and a tooltip shows its label (Day 8, Hour 12…) and value. It works the same with a finger drag on touch screens.
- 4Switch the periodClick 30d, 7d or 24h. The pill slides across, every value counts to its new number, sparklines redraw and the breakdown bars animate to new widths — all from the
PERIODSobject. - 5Replace the dataEdit the
PERIODSobject:vis the value,tthe signed percentage change,dthe sparkline points. For an API, fillPERIODSfrom your response and callrender(period). - 6Mark "lower is better" metricsFor churn, errors or latency, add
lowerIsBetter: trueto that metric inMETRICS. A falling number then gets a green badge instead of red.
Real-world uses
Common Use Cases
Got questions?
Frequently Asked Questions
The toggle already calls render(period), which reads from the PERIODS object. Fetch your metrics, fill PERIODS[period] in the same shape (value v, change t, points d), then call render. Cancel or ignore stale responses if users switch periods quickly.
Add lowerIsBetter: true to that metric inside METRICS, for example churn: { fmt: ..., lowerIsBetter: true }. The arrow still points down, but the badge gets the green good style instead of red.
Copy one <article class="metric-card" data-key="...">, give it a new data-key and accent colours, add a matching entry to METRICS and to each period in PERIODS. Then adjust the grid to repeat(auto-fit, minmax(190px, 1fr)) if you want it to wrap on its own.
A spline area line shows trend more clearly at small sizes and enables a snap-to-point hover. It uses one path per card, so it stays light. If you prefer bars, replace drawSpark with a function that creates one <div> per value sized by value / max.
Make a MetricCard with {label, value, change, data, color, icon, lowerIsBetter} props and a Sparkline that renders the SVG path from data. Keep the active period in useState, fetch in useEffect([period]), and reuse the count-up logic in a small useCountUp hook.