



Sparkline Chart — Free HTML CSS JS Canvas Snippet
Sparkline Chart · Charts · Plain HTML, CSS & JS · Live preview
Copy & paste
Source Code
<div class="wrap">

  <div class="cards-grid">

    <div class="metric-card">
      <div class="metric-head">
        <div class="metric-info">
          <div class="metric-label">Revenue</div>
          <div class="metric-value">$48,295</div>
          <div class="metric-change up">↑ 12.4%</div>
        </div>
        <canvas class="sparkline" id="sp-revenue" width="100" height="40"></canvas>
      </div>
    </div>

    <div class="metric-card">
      <div class="metric-head">
        <div class="metric-info">
          <div class="metric-label">Active users</div>
          <div class="metric-value">1,847</div>
          <div class="metric-change up">↑ 8.1%</div>
        </div>
        <canvas class="sparkline" id="sp-users" width="100" height="40"></canvas>
      </div>
    </div>

    <div class="metric-card">
      <div class="metric-head">
        <div class="metric-info">
          <div class="metric-label">Bounce rate</div>
          <div class="metric-value">34.2%</div>
          <div class="metric-change down">↓ 3.2%</div>
        </div>
        <canvas class="sparkline" id="sp-bounce" width="100" height="40"></canvas>
      </div>
    </div>

    <div class="metric-card">
      <div class="metric-head">
        <div class="metric-info">
          <div class="metric-label">Conversion</div>
          <div class="metric-value">5.8%</div>
          <div class="metric-change up">↑ 0.6%</div>
        </div>
        <canvas class="sparkline" id="sp-conv" width="100" height="40"></canvas>
      </div>
    </div>

  </div>

</div>
* { box-sizing: border-box; margin: 0; padding: 0; }
body { font-family: system-ui, sans-serif; background: #f8fafc; min-height: 100vh; display: flex; align-items: center; justify-content: center; padding: 28px 20px; }
.wrap { width: 100%; max-width: 560px; }
.cards-grid { display: grid; grid-template-columns: 1fr 1fr; gap: 12px; }
.metric-card { background: #fff; border-radius: 14px; padding: 16px; border: 1px solid #e2e8f0; box-shadow: 0 1px 6px rgba(0,0,0,0.05); }
.metric-head { display: flex; align-items: center; justify-content: space-between; gap: 12px; }
.metric-label { font-size: 11px; font-weight: 600; text-transform: uppercase; letter-spacing: 0.5px; color: #94a3b8; margin-bottom: 3px; }
.metric-value { font-size: 22px; font-weight: 800; color: #0f172a; line-height: 1; margin-bottom: 4px; }
.metric-change { font-size: 11px; font-weight: 700; }
.metric-change.up { color: #16a34a; }
.metric-change.down { color: #dc2626; }
.sparkline { flex-shrink: 0; }const DATA = {
revenue: [28,32,27,35,30,38,34,42,38,45,41,48],
users: [1200,1150,1300,1250,1400,1350,1500,1480,1600,1720,1800,1847],
bounce: [42,40,43,41,38,40,37,38,36,35,34,34],
conv: [4.8,5.1,4.9,5.3,5.0,5.4,5.2,5.6,5.5,5.7,5.9,5.8],
};
const COLORS = {
revenue: { line: '#6366f1', fill: 'rgba(99,102,241,0.12)' },
users: { line: '#10b981', fill: 'rgba(16,185,129,0.12)' },
bounce: { line: '#ef4444', fill: 'rgba(239,68,68,0.12)' },
conv: { line: '#f59e0b', fill: 'rgba(245,158,11,0.12)' },
};
function drawSparkline(canvasId, dataKey) {
const canvas = document.getElementById(canvasId);
if (!canvas) return;
const ctx = canvas.getContext('2d');
const data = DATA[dataKey];
const color = COLORS[dataKey];
const w = canvas.width, h = canvas.height;
const pad = 4;
const min = Math.min(...data);
const max = Math.max(...data);
const range = max - min || 1;
const xStep = (w - pad*2) / (data.length - 1);
const yScale = (h - pad*2) / range;
const pts = data.map((v, i) => ({
x: pad + i * xStep,
y: h - pad - (v - min) * yScale,
}));
ctx.clearRect(0, 0, w, h);
// Gradient fill
const grad = ctx.createLinearGradient(0, 0, 0, h);
grad.addColorStop(0, color.fill);
grad.addColorStop(1, 'rgba(255,255,255,0)');
ctx.beginPath();
ctx.moveTo(pts[0].x, pts[0].y);
for (let i = 1; i < pts.length; i++) {
const mx = (pts[i-1].x + pts[i].x) / 2;
ctx.bezierCurveTo(mx, pts[i-1].y, mx, pts[i].y, pts[i].x, pts[i].y);
}
ctx.lineTo(pts[pts.length-1].x, h);
ctx.lineTo(pts[0].x, h);
ctx.closePath();
ctx.fillStyle = grad;
ctx.fill();
// Line
ctx.beginPath();
ctx.moveTo(pts[0].x, pts[0].y);
for (let i = 1; i < pts.length; i++) {
const mx = (pts[i-1].x + pts[i].x) / 2;
ctx.bezierCurveTo(mx, pts[i-1].y, mx, pts[i].y, pts[i].x, pts[i].y);
}
ctx.strokeStyle = color.line;
ctx.lineWidth = 1.8;
ctx.lineJoin = 'round';
ctx.stroke();
// End dot
const last = pts[pts.length-1];
ctx.beginPath();
ctx.arc(last.x, last.y, 3, 0, Math.PI*2);
ctx.fillStyle = color.line;
ctx.fill();
}
drawSparkline('sp-revenue', 'revenue');
drawSparkline('sp-users', 'users');
drawSparkline('sp-bounce', 'bounce');
drawSparkline('sp-conv', 'conv');Extend with AI
Take This Snippet Further With AI
The AI prompt for this one is for Patreon supporters ($3 a month), along with a site with no ads. Supporters enter the passcode once and it is remembered in this browser.
What's included
Features
About this UI Snippet
Sparkline Chart — Canvas Bezier Curve, Gradient Fill, End Dot & Normalised Coordinates
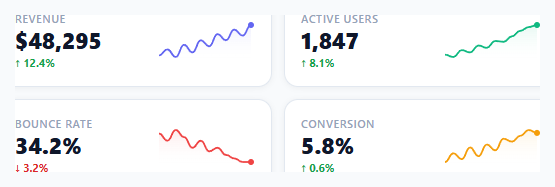
A full chart needs axes, gridlines, a legend, and room to breathe. A sparkline needs none of that — just enough ink to answer "is this going up or down?" in the time it takes an eye to pass over a number. Edward Tufte coined the term for exactly this kind of "intense, simple, word-sized graphic," and it's now the default companion to any KPI on a dashboard: a revenue figure means little until a tiny rising line beside it says *and it's been climbing all month*. This snippet draws four such metric cards directly to <canvas> — smooth curves instead of jagged polylines, a soft gradient fill beneath the line, a dot marking the latest value, and a coordinate system that adapts itself to whatever numbers you hand it.
Mapping arbitrary numbers onto a fixed-size canvas
Revenue might range from 27 to 48; active users from 1,150 to 1,847. Both need to fill the same 100×40 canvas without the chart author hand-tuning a scale for each metric. The fix is normalisation: (value - min) / range converts any number in the dataset into a position between 0 and 1 — purely *where it sits relative to the dataset's own minimum and maximum* — and multiplying that fraction by the canvas's available height converts it into pixels. The final twist, canvasHeight - padding - scaledValue, flips the result, because canvas coordinates grow *downward* from the top-left corner while every chart convention on Earth expects "higher value" to mean "higher on the screen."
Smooth curves from a single line of geometry
ctx.lineTo would connect the data points with sharp, jagged corners — technically accurate, visually noisy. Instead, each segment uses ctx.bezierCurveTo with control points placed at the horizontal midpoint between consecutive points: const mx = (prev.x + next.x) / 2. Anchoring both control points to that shared midpoint — one paired with the previous point's height, one with the next's — produces a curve that eases smoothly out of one point and into the next, with no separate smoothing pass or external charting math required. It's the same "let geometry do the work" instinct behind the gliding indicator in the Scroll-Spy Navigation snippet.
A gradient that fades the story toward the baseline
The filled area beneath each line uses createLinearGradient running from an opaque tint at the top to fully transparent at the bottom — drawn by tracing the curve, dropping straight down to the canvas floor, and closing the path back to the start before calling ctx.fill(). The fade keeps the eye anchored on the *line*, which carries the actual information, while the colour wash beneath it adds just enough visual weight to read as "area under a trend" rather than a bare line floating in space.
Why canvas, not SVG, for a wall of small charts
A dashboard might show twenty or fifty of these at once. Each SVG sparkline would be its own subtree of DOM nodes for the browser to parse, lay out, and keep in memory; a canvas sparkline is a handful of draw calls into a single bitmap that simply *is* what it looks like — no nodes, no reflow, trivially cheap to redraw on a live data tick. For a handful of hero charts, SVG's crispness and CSS-styleability often win; for a grid of glanceable trend lines like the Stats Card or Line Chart Widget might use, canvas is the pragmatic choice.
Step by step
How to Use
- 1View the four metric cards with their sparklinesEach card shows a label, value, percentage change, and a mini sparkline chart. The last data point has an endpoint dot. Green for growth metrics, red for bounce rate (where lower is better).
- 2Replace the DATA arrays with your own metricsUpdate the DATA object: each key is a canvas ID suffix (sp-X), the value is an array of numbers. Use the last 7, 14, or 30 days of data. The sparkline automatically normalises to fit any range.
- 3Change sparkline coloursUpdate COLORS: each key needs a line colour (hex) and fill colour (rgba with low opacity). Match the colour to the metric's semantic meaning — green for growth, red for declining metrics, blue for neutral.
- 4Add more metric cardsDuplicate a .metric-card div and add matching entries to DATA and COLORS. Call drawSparkline("sp-newkey", "newkey") at the bottom. The 2-column grid automatically accommodates more cards.
- 5Animate the sparkline on loadFor an animated draw effect, modify drawSparkline to draw progressively: use requestAnimationFrame and draw only the first N points per frame, incrementing N until all points are drawn. This creates a left-to-right reveal animation.
- 6Export in your formatClick "HTML" for a standalone file, "JSX" for a React component using useRef for canvases and useEffect for drawing, or "Tailwind" for a React + Tailwind CSS version.
Real-world uses
Common Use Cases
Got questions?
Frequently Asked Questions
Two calculations: X = padding + (index / (dataLength - 1)) × availableWidth. Y = canvasHeight - padding - ((value - min) / range) × availableHeight. The X formula distributes points evenly across the canvas width. The Y formula: (value - min) / range normalises the value to 0-to-1, then multiplying by availableHeight scales to pixels. Subtracting from canvasHeight - padding inverts the Y axis (canvas Y increases downward, but charts conventionally show higher values higher up).
For each pair of adjacent points (prev, next), the midpoint mx = (prev.x + next.x) / 2 is computed. bezierCurveTo uses (mx, prev.y) as the first control point and (mx, next.y) as the second. The first control point extends horizontally from the previous point, and the second extends horizontally to the next point. This creates a smooth curve that transitions horizontally between each data point.
Call drawSparkline(canvasId, dataKey) whenever the data updates. In the DATA object, push new values and shift old ones to maintain a fixed length: DATA.revenue.push(newValue); DATA.revenue.shift(). Then redraw: drawSparkline("sp-revenue", "revenue"). For a 1-second update: setInterval(() => { fetchMetric().then(v => { DATA.revenue.push(v); DATA.revenue.shift(); drawSparkline("sp-revenue", "revenue"); }); }, 1000).
Click "JSX" to download. Use useRef(null) for each canvas element: const revenueRef = useRef(null). The drawSparkline function takes the canvas element directly instead of looking up by ID. Call it in useEffect: useEffect(() => { drawSparkline(revenueRef.current, "revenue", data.revenue, COLORS.revenue); }, [data]). When data changes, the useEffect dependency fires and the sparkline redraws automatically.