



Org Chart in HTML & CSS — Collapsible, Searchable Tree
Org Chart · Charts · Plain HTML, CSS & JS · Live preview
Copy & paste
Source Code
<div class="wrap">
<div class="chart-head">
<div>
<h2 class="chart-title">Organisation Chart</h2>
<p class="chart-sub" id="orgStatus"></p>
</div>
<div class="zoom" role="group" aria-label="Zoom">
<button type="button" class="zbtn" id="zOut" aria-label="Zoom out">−</button>
<button type="button" class="zval" id="zFit" title="Fit to width">100%</button>
<button type="button" class="zbtn" id="zIn" aria-label="Zoom in">+</button>
</div>
</div>
<div class="tools">
<label class="search">
<svg width="14" height="14" viewBox="0 0 24 24" fill="none" stroke="currentColor" stroke-width="2.4" stroke-linecap="round" aria-hidden="true"><circle cx="11" cy="11" r="7"/><path d="m20 20-3.5-3.5"/></svg>
<input id="orgSearch" type="search" placeholder="Search name or role" autocomplete="off" aria-label="Search people">
</label>
<button type="button" class="tbtn" id="collapseAll">Collapse teams</button>
<button type="button" class="tbtn" id="expandAll">Expand all</button>
</div>
<div class="chips" id="orgChips" role="group" aria-label="Filter by department"></div>
<div class="stage" id="stage"><div class="org" id="org"></div></div>
</div>* { box-sizing: border-box; margin: 0; padding: 0; }
body { font-family: system-ui, -apple-system, sans-serif; background: #eef2f7; min-height: 100vh; padding: 28px 20px; color: #0f172a; }
button { font: inherit; color: inherit; border: 0; background: none; cursor: pointer; }
.wrap { max-width: 980px; margin: 0 auto; background: #fff; border-radius: 20px; padding: 22px; box-shadow: 0 1px 2px rgba(15,23,42,.05), 0 22px 48px rgba(15,23,42,.08); }
.chart-head { display: flex; align-items: flex-start; justify-content: space-between; gap: 12px; margin-bottom: 14px; }
.chart-title { font-size: 19px; font-weight: 800; letter-spacing: -.01em; }
.chart-sub { font-size: 12.5px; color: #64748b; margin-top: 2px; font-variant-numeric: tabular-nums; }
.zoom { display: inline-flex; align-items: center; background: #f1f5f9; border-radius: 999px; padding: 3px; flex: none; }
.zbtn, .zval { height: 26px; border-radius: 999px; font-weight: 700; color: #475569; transition: background .15s, color .15s; }
.zbtn { width: 26px; font-size: 16px; line-height: 1; }
.zval { min-width: 48px; padding: 0 6px; font-size: 12px; font-variant-numeric: tabular-nums; }
.zbtn:hover, .zval:hover { background: #fff; color: #4338ca; }
.tools { display: flex; flex-wrap: wrap; gap: 8px; margin-bottom: 10px; }
.search { position: relative; flex: 1 1 200px; display: flex; align-items: center; }
.search svg { position: absolute; left: 11px; color: #94a3b8; pointer-events: none; }
.search input { width: 100%; height: 34px; padding: 0 12px 0 32px; border: 1.5px solid #e2e8f0; border-radius: 10px; font: inherit; font-size: 13px; background: #f8fafc; outline: 0; transition: border-color .15s, box-shadow .15s, background .15s; }
.search input:focus { border-color: #6366f1; background: #fff; box-shadow: 0 0 0 3px rgba(99,102,241,.15); }
.tbtn { height: 34px; padding: 0 13px; border-radius: 10px; border: 1.5px solid #e2e8f0; font-size: 12.5px; font-weight: 700; color: #475569; transition: border-color .15s, color .15s, background .15s; }
.tbtn:hover { border-color: #818cf8; color: #4338ca; background: #f5f3ff; }
.chips { display: flex; flex-wrap: wrap; gap: 6px; margin-bottom: 8px; }
.chip { display: inline-flex; align-items: center; gap: 6px; padding: 5px 11px 5px 9px; border-radius: 999px; background: #f1f5f9; font-size: 12px; font-weight: 700; color: #475569; transition: background .15s, color .15s, box-shadow .15s; }
.chip i { width: 8px; height: 8px; border-radius: 50%; background: var(--c); }
.chip span { color: #94a3b8; font-weight: 600; font-variant-numeric: tabular-nums; }
.chip:hover { background: #e2e8f0; }
.chip[aria-pressed="true"] { background: #fff; color: #0f172a; box-shadow: 0 0 0 1.5px var(--c); }
.tbtn:focus-visible, .chip:focus-visible, .zbtn:focus-visible, .zval:focus-visible, .node:focus-visible { outline: 2px solid #4338ca; outline-offset: 2px; }
.stage { overflow-x: auto; padding: 22px 16px 14px; border-radius: 14px; background: radial-gradient(circle at 1px 1px, #dbe3ee 1px, transparent 0) 0 0 / 18px 18px, #f8fafc; }
.org { width: max-content; margin: 0 auto; }
/* --- the tree: nested lists, connector lines drawn with pseudo-elements --- */
.tree, .tree ul { display: flex; justify-content: center; list-style: none; position: relative; }
.tree ul { padding-top: 22px; animation: org-fade .3s ease; }
.tree ul::before { content: ''; position: absolute; top: 0; left: 50%; transform: translateX(-50%); width: 2px; height: 22px; background: #cbd5e1; }
.tree li { display: flex; flex-direction: column; align-items: center; position: relative; padding: 22px 5px 0; }
.tree li::before { content: ''; position: absolute; top: 0; left: 50%; transform: translateX(-50%); width: 2px; height: 22px; background: #cbd5e1; }
.tree li::after { content: ''; position: absolute; top: 0; left: 0; width: 100%; height: 2px; background: #cbd5e1; }
.tree li:first-child::after { left: 50%; width: 50%; }
.tree li:last-child::after { width: 50%; }
.tree li:only-child::after { display: none; }
.tree > li { padding-top: 0; }
.tree > li::before, .tree > li::after { display: none; }
.tree ul.collapsed { display: none; }
.node { position: relative; display: flex; align-items: center; gap: 9px; min-width: 146px; text-align: left; background: #fff; border: 1.5px solid #e2e8f0; border-top: 3px solid var(--c); border-radius: 12px; padding: 7px 11px 7px 8px; box-shadow: 0 1px 3px rgba(15,23,42,.05);
transition: transform .15s, box-shadow .15s, border-color .15s, opacity .2s; animation: org-in .45s cubic-bezier(.2,.8,.2,1) backwards; animation-delay: calc(var(--d) * 90ms); }
button.node:hover { transform: translateY(-2px); box-shadow: 0 8px 20px -6px rgba(15,23,42,.2); border-color: var(--c); }
.node.root { background: linear-gradient(180deg, #fff, #f5f3ff); }
.node.vacant { border-style: dashed; border-top-style: dashed; background: #f8fafc; }
.av { width: 32px; height: 32px; border-radius: 50%; flex: none; display: flex; align-items: center; justify-content: center; color: #fff; font-size: 12.5px; font-weight: 800; background: linear-gradient(140deg, var(--c), color-mix(in srgb, var(--c) 60%, #000)); }
.vacant .av { background: #e2e8f0; color: #64748b; font-size: 18px; font-weight: 600; }
.info { display: flex; flex-direction: column; min-width: 0; }
.name { font-size: 13.5px; font-weight: 700; white-space: nowrap; }
.role { font-size: 11px; color: #64748b; white-space: nowrap; }
.count { position: absolute; right: -8px; top: -11px; min-width: 22px; height: 20px; padding: 0 6px; border-radius: 10px; background: var(--c); color: #fff; font-size: 10.5px; font-weight: 800; display: flex; align-items: center; justify-content: center; font-variant-numeric: tabular-nums; box-shadow: 0 0 0 2px #fff; }
.node.is-closed .count { background: #0f172a; }
.node.dim { opacity: .25; }
.node.hit { box-shadow: 0 0 0 3px color-mix(in srgb, var(--c) 35%, transparent), 0 8px 20px -6px rgba(15,23,42,.2); border-color: var(--c); }
@keyframes org-in { from { opacity: 0; transform: translateY(8px) scale(.94); } to { opacity: 1; transform: none; } }
@keyframes org-fade { from { opacity: 0; } to { opacity: 1; } }
@media (prefers-reduced-motion: reduce) { .node, .tree ul { animation: none; } .node { transition: none; } }
@media (max-width: 520px) { body { padding: 14px 10px; } .wrap { padding: 16px; } .chart-head { flex-wrap: wrap; } }// Departments: colour and label used by the card accent, the avatar and the filter chips.
var DEPTS = {
exec: { label: 'Leadership', color: '#6366f1' },
eng: { label: 'Engineering', color: '#0284c7' },
design: { label: 'Design', color: '#9333ea' },
sales: { label: 'Sales', color: '#d97706' },
people: { label: 'People', color: '#059669' },
};
// Your data: a nested tree. Add { vacant: true } for an open role.
var TREE = { name: 'Elena Carter', role: 'CEO', dept: 'exec', children: [
{ name: 'Marcus Reed', role: 'VP Engineering', dept: 'eng', children: [
{ name: 'Aisha Tran', role: 'Frontend Lead', dept: 'eng' },
{ name: 'David Kim', role: 'Backend Lead', dept: 'eng' },
{ name: 'Open role', role: 'DevOps Engineer', dept: 'eng', vacant: true },
] },
{ name: 'Sophie Nguyen', role: 'VP Design', dept: 'design', children: [
{ name: 'Jon Marsh', role: 'Product Designer', dept: 'design' },
{ name: 'Lily Wong', role: 'UX Researcher', dept: 'design' },
] },
{ name: 'Tom Baker', role: 'VP Sales', dept: 'sales', children: [
{ name: 'Priya Shah', role: 'Account Executive', dept: 'sales' },
{ name: 'Noah Berg', role: 'SDR Team Lead', dept: 'sales', children: [
{ name: 'Mia Lopez', role: 'Sales Rep', dept: 'sales' },
] },
] },
{ name: 'Grace Okafor', role: 'Head of People', dept: 'people' },
] };
var org = document.getElementById('org');
var stage = document.getElementById('stage');
var search = document.getElementById('orgSearch');
var status = document.getElementById('orgStatus');
var chips = document.getElementById('orgChips');
var dept = null; // active department filter
var people = 0, open = 0, perDept = {};
function esc(s) { return String(s).replace(/[&<>"]/g, function (c) { return { '&': '&', '<': '<', '>': '>', '"': '"' }[c]; }); }
function initials(n) { return n.split(' ').map(function (w) { return w[0]; }).slice(0, 2).join(''); }
function descendants(p) { return (p.children || []).reduce(function (n, c) { return n + 1 + descendants(c); }, 0); }
function build(p, depth) {
var kids = p.children || [];
if (p.vacant) open++; else { people++; perDept[p.dept] = (perDept[p.dept] || 0) + 1; }
var tag = kids.length ? 'button' : 'div';
var attrs = ' class="node' + (depth === 0 ? ' root' : '') + (p.vacant ? ' vacant' : '') + '" data-dept="' + p.dept + '"' +
' data-text="' + esc((p.name + ' ' + p.role).toLowerCase()) + '" style="--c:' + DEPTS[p.dept].color + ';--d:' + depth + '"' +
(kids.length ? ' type="button" aria-expanded="true" data-direct="' + kids.length + '" data-total="' + descendants(p) + '"' : '');
return '<li><' + tag + attrs + '>' +
'<span class="av">' + (p.vacant ? '+' : esc(initials(p.name))) + '</span>' +
'<span class="info"><span class="name">' + esc(p.name) + '</span><span class="role">' + esc(p.role) + '</span></span>' +
(kids.length ? '<span class="count" title="Direct reports">' + kids.length + '</span>' : '') +
'</' + tag + '>' +
(kids.length ? '<ul>' + kids.map(function (c) { return build(c, depth + 1); }).join('') + '</ul>' : '') +
'</li>';
}
org.innerHTML = '<ul class="tree">' + build(TREE, 0) + '</ul>';
var tree = org.querySelector('.tree');
// Department chips (click to filter)
chips.innerHTML = Object.keys(DEPTS).map(function (k) {
return '<button type="button" class="chip" data-k="' + k + '" aria-pressed="false" style="--c:' + DEPTS[k].color + '"><i></i>' +
DEPTS[k].label + ' <span>' + (perDept[k] || 0) + '</span></button>';
}).join('');
// Collapse or expand one manager's team, and update its badge (direct reports, or "+N" hidden).
function setCollapsed(ul, closed) {
ul.classList.toggle('collapsed', closed);
var node = ul.parentElement.querySelector(':scope > .node');
node.setAttribute('aria-expanded', String(!closed));
node.classList.toggle('is-closed', closed);
node.querySelector('.count').textContent = closed ? '+' + node.dataset.total : node.dataset.direct;
}
function toggle(node) {
var ul = node.parentElement.querySelector(':scope > ul');
setCollapsed(ul, !ul.classList.contains('collapsed'));
refit();
}
org.addEventListener('click', function (e) {
var node = e.target.closest('.node');
if (node && node.dataset.direct) toggle(node);
});
document.getElementById('collapseAll').addEventListener('click', function () {
org.querySelectorAll('.node[data-direct]:not(.root)').forEach(function (n) { setCollapsed(n.parentElement.querySelector(':scope > ul'), true); });
refit();
});
document.getElementById('expandAll').addEventListener('click', function () {
org.querySelectorAll('ul.collapsed').forEach(function (ul) { setCollapsed(ul, false); });
refit();
});
// Search + department filter: matches are highlighted, everyone else dims,
// and any collapsed branch that hides a match is opened.
function expandPath(node) {
var ul = node.closest('li').parentElement;
while (ul && ul.tagName === 'UL') {
if (ul.classList.contains('collapsed')) setCollapsed(ul, false);
ul = ul.parentElement.parentElement;
}
}
function applyFilter() {
var q = search.value.trim().toLowerCase(), active = !!(q || dept), hits = 0;
org.querySelectorAll('.node').forEach(function (n) {
var ok = (!dept || n.dataset.dept === dept) && (!q || n.dataset.text.indexOf(q) > -1);
n.classList.toggle('hit', active && ok);
n.classList.toggle('dim', active && !ok);
if (active && ok) { hits++; expandPath(n); }
});
status.textContent = active
? hits + (hits === 1 ? ' match' : ' matches') + ' of ' + (people + open) + ' positions'
: people + ' people \u00b7 ' + open + ' open role' + (open === 1 ? '' : 's') + ' \u00b7 click a manager to fold their team';
refit();
}
search.addEventListener('input', applyFilter);
chips.addEventListener('click', function (e) {
var chip = e.target.closest('.chip');
if (!chip) return;
dept = dept === chip.dataset.k ? null : chip.dataset.k;
chips.querySelectorAll('.chip').forEach(function (c) { c.setAttribute('aria-pressed', String(c.dataset.k === dept)); });
applyFilter();
});
// Zoom: fit-to-width by default, or step with the - / + buttons.
var zoom = 1, auto = true, zFit = document.getElementById('zFit');
function setZoom(z) {
zoom = Math.max(0.5, Math.min(1.3, z));
tree.style.zoom = zoom;
zFit.textContent = Math.round(zoom * 100) + '%';
}
function fit() {
tree.style.zoom = 1;
setZoom(Math.min(1, (stage.clientWidth - 32) / tree.offsetWidth));
}
function refit() { if (auto) fit(); }
document.getElementById('zOut').addEventListener('click', function () { auto = false; setZoom(zoom - 0.1); });
document.getElementById('zIn').addEventListener('click', function () { auto = false; setZoom(zoom + 0.1); });
zFit.addEventListener('click', function () { auto = true; fit(); });
if (window.ResizeObserver) new ResizeObserver(refit).observe(stage);
else window.addEventListener('resize', refit);
applyFilter();
fit();Extend with AI
Take This Snippet Further With AI
The AI prompt for this one is for Patreon supporters ($3 a month), along with a site with no ads. Supporters enter the passcode once and it is remembered in this browser.
What's included
Features
About this UI Snippet
Org Chart — CSS Connector Tree with Search, Department Filters and Zoom-to-Fit
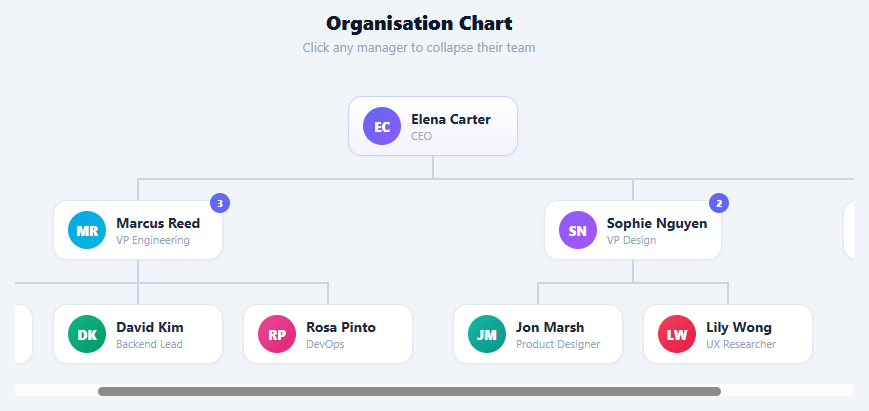
An org chart shows who reports to whom, and the hard part is not drawing boxes but keeping a tree readable once it has more than a dozen people. This snippet builds the whole chart from one nested JavaScript object. The connector lines are plain CSS on nested lists, managers fold their teams with a click, a search box and department chips highlight matches, and the chart zooms itself to fit its container, so it stays usable from a phone to a wide dashboard with no SVG and no library.
Connectors drawn with pseudo-elements
Each person is a list item inside the list of their manager. A ::before draws the short vertical drop into the card, and an ::after draws the horizontal bar that joins siblings. :first-child and :last-child trim that bar to half width at the ends so it spans exactly from the first to the last sibling, and :only-child removes it for a lone report. Because the lines belong to the list structure, adding a person never means touching any coordinates.
Built from a data tree
The TREE object holds name, role, department and optional children, and build() turns it into the nested markup recursively. Managers render as buttons with aria-expanded, individual contributors as plain cards, and a person marked vacant: true renders as a dashed "Open role" card so hiring gaps show on the chart. The DEPTS map supplies each department's colour, used for the card's top accent, the avatar gradient and the filter chips.
Fold a team, see what is hidden
Clicking a manager hides their list with :scope > ul, which reaches only that manager's direct reports. The badge switches from the number of direct reports to "+N" with the full count of hidden people, so a collapsed branch still tells you how big it is. Collapse teams folds everything below the top row; Expand all opens it back up.
Search and department filters
Typing in the search box matches name or role, and clicking a department chip filters by team; both can be combined. Matching people get a coloured ring, everyone else dims to 25%, and any collapsed branch hiding a match opens automatically. A status line reports how many positions match.
Zoom to fit
A wide hierarchy no longer needs sideways scrolling: the chart measures its natural width and sets zoom so it fits the container, re-fitting on resize and whenever a branch folds. The − and + buttons give manual control from 50% to 130%, and clicking the percentage returns to fit.
Motion and accessibility
Cards fade up level by level, and an expanding branch fades in. Everything respects prefers-reduced-motion, and every interactive element is a real button with a visible focus ring.
Step by step
How to Use
- 1Paste HTML, CSS and JSThe chart builds itself from the TREE object, fitting the container, with cards fading in level by level.
- 2Click a managerTheir team folds away and the badge changes from the direct-report count to "+N" hidden people. Click again to open it.
- 3Search or filterType a name or role, or click a department chip. Matches get a ring, others dim, and folded branches that hide a match open.
- 4ZoomUse − and + to change the scale from 50% to 130%; click the percentage to fit the chart to its container again.
- 5Edit TREE and DEPTSAdd people as nested children with a name, role and dept key. Add { vacant: true } for an open position, and add colours in DEPTS for new teams.
- 6Use photosIn build(), replace the initials span with an img tag using a photo URL stored on each person.
Real-world uses
Common Use Cases
Got questions?
Frequently Asked Questions
Each person is a list item. A ::before draws the vertical drop from the sibling bar into the card, and an ::after draws the horizontal bar. :first-child and :last-child cut the bar to half width at the ends, and :only-child hides it for a lone report. The lines belong to the list, so adding a person never needs coordinates.
For every match, expandPath() walks up from its list item through each parent list and removes the collapsed state from any that are hidden, updating the manager's aria-expanded and badge as it goes. Non-matching people dim instead of disappearing, so the shape of the organisation stays visible.
Transform scales the drawing but not the layout, so a wide chart would still produce a horizontal scrollbar. CSS zoom changes the layout size, so the scrollbar disappears when the chart fits. Zoom is supported in Chrome, Safari and recent Firefox; in older browsers the chart simply stays at 100% and scrolls.
Convert your data into the TREE shape: a name, role and dept per person with children nested. If you have a flat list with managerId, group by managerId and attach each person's reports recursively. Then add the departments you use to DEPTS and the chart, chips and counts all follow.