



Area Chart — SVG Trend Chart HTML CSS JS Snippet
Area Chart · Charts · Plain HTML, CSS & JS · Live preview
Copy & paste
Source Code
<div class="ac-card">
  <div class="ac-head">
    <div>
      <h2 class="ac-title">Monthly active users</h2>
      <div class="ac-value"><span id="acVal">—</span> <span class="ac-month" id="acMonth">hover the chart</span></div>
    </div>
    <div class="ac-peak"><span id="acPeak">0</span> peak</div>
  </div>

  <div class="ac-plot" id="acPlot">
    <svg class="ac-svg" viewBox="0 0 320 170" preserveAspectRatio="none">
      <defs>
        <linearGradient id="acGrad" x1="0" y1="0" x2="0" y2="1">
          <stop offset="0%" stop-color="#6366f1" stop-opacity="0.34"/>
          <stop offset="100%" stop-color="#6366f1" stop-opacity="0"/>
        </linearGradient>
      </defs>
      <line class="ac-grid" x1="8" y1="22" x2="312" y2="22"/>
      <line class="ac-grid" x1="8" y1="74" x2="312" y2="74"/>
      <line class="ac-grid" x1="8" y1="126" x2="312" y2="126"/>
      <path id="acArea" class="ac-area" d=""/>
      <path id="acLine" class="ac-stroke" d=""/>
      <line id="acVLine" class="ac-vline" x1="0" y1="14" x2="0" y2="140" style="opacity:0"/>
      <circle id="acDot" class="ac-dot" r="4" style="opacity:0"/>
    </svg>
    <div class="ac-xlabels" id="acXlabels"></div>
    <div class="ac-tip" id="acTip"></div>
  </div>
</div>*{box-sizing:border-box;margin:0;padding:0}
body{font-family:system-ui,-apple-system,sans-serif;background:#f1f5f9;min-height:100vh;display:flex;align-items:center;justify-content:center;padding:24px}
.ac-card{background:#fff;border:1px solid #e2e8f0;border-radius:18px;padding:22px;width:100%;max-width:440px;box-shadow:0 14px 44px rgba(15,23,42,.07)}
.ac-head{display:flex;align-items:flex-start;justify-content:space-between;margin-bottom:14px}
.ac-title{font-size:16px;font-weight:800;color:#1e293b}
.ac-value{display:flex;align-items:baseline;gap:7px;margin-top:5px}
.ac-value #acVal{font-size:24px;font-weight:800;color:#6366f1;font-variant-numeric:tabular-nums}
.ac-month{font-size:12px;color:#94a3b8;font-weight:600}
.ac-peak{font-size:11px;color:#94a3b8;font-weight:600}
.ac-peak span{color:#1e293b;font-weight:800}
.ac-plot{position:relative}
.ac-svg{width:100%;height:170px;display:block}
.ac-grid{stroke:#f1f5f9;stroke-width:1}
.ac-area{fill:url(#acGrad)}
.ac-stroke{fill:none;stroke:#6366f1;stroke-width:2.5;stroke-linejoin:round;stroke-linecap:round}
.ac-vline{stroke:#c7d2fe;stroke-width:1.5;stroke-dasharray:3 3;transition:opacity .12s}
.ac-dot{fill:#fff;stroke:#6366f1;stroke-width:2.5;transition:opacity .12s}
.ac-xlabels{display:flex;justify-content:space-between;padding:6px 4px 0;font-size:10px;color:#cbd5e1;font-weight:600}
.ac-tip{position:absolute;top:-2px;transform:translateX(-50%);background:#1e293b;color:#fff;font-size:11px;font-weight:700;padding:4px 9px;border-radius:7px;white-space:nowrap;opacity:0;pointer-events:none;transition:opacity .12s}var DATA = [
{ m: 'Jan', v: 3200 }, { m: 'Feb', v: 4100 }, { m: 'Mar', v: 3800 },
{ m: 'Apr', v: 5200 }, { m: 'May', v: 4900 }, { m: 'Jun', v: 6400 },
{ m: 'Jul', v: 6000 }, { m: 'Aug', v: 7300 }, { m: 'Sep', v: 6900 },
{ m: 'Oct', v: 8200 }, { m: 'Nov', v: 7800 }, { m: 'Dec', v: 9100 }
];
var X0 = 8, X1 = 312, TOP = 16, BOT = 140;
var pts = [];
var plot, svg, dot, vline, tip;
function smooth(p) {
if (p.length < 2) return '';
var d = 'M ' + p[0][0].toFixed(1) + ' ' + p[0][1].toFixed(1);
for (var i = 0; i < p.length - 1; i++) {
var p0 = p[i - 1] || p[i], p1 = p[i], p2 = p[i + 1], p3 = p[i + 2] || p2;
var c1x = p1[0] + (p2[0] - p0[0]) / 6, c1y = p1[1] + (p2[1] - p0[1]) / 6;
var c2x = p2[0] - (p3[0] - p1[0]) / 6, c2y = p2[1] - (p3[1] - p1[1]) / 6;
d += ' C ' + c1x.toFixed(1) + ' ' + c1y.toFixed(1) + ' ' + c2x.toFixed(1) + ' ' + c2y.toFixed(1) + ' ' + p2[0].toFixed(1) + ' ' + p2[1].toFixed(1);
}
return d;
}
function render() {
var vals = DATA.map(function (d) { return d.v; });
var min = Math.min.apply(null, vals), max = Math.max.apply(null, vals);
var pad = (max - min) * 0.15 || 1;
min -= pad; max += pad;
var step = (X1 - X0) / (DATA.length - 1);
pts = DATA.map(function (d, i) {
return [X0 + i * step, BOT - ((d.v - min) / (max - min)) * (BOT - TOP)];
});
var line = smooth(pts);
document.getElementById('acLine').setAttribute('d', line);
document.getElementById('acArea').setAttribute('d', line + ' L ' + X1 + ' ' + BOT + ' L ' + X0 + ' ' + BOT + ' Z');
document.getElementById('acXlabels').innerHTML = DATA.map(function (d, i) {
return (i % 2 === 0) ? '<span>' + d.m + '</span>' : '<span></span>';
}).join('');
document.getElementById('acPeak').textContent = Math.max.apply(null, vals).toLocaleString();
}
function onMove(e) {
var rect = svg.getBoundingClientRect();
var ratio = (e.clientX - rect.left) / rect.width;
var i = Math.max(0, Math.min(DATA.length - 1, Math.round(ratio * (DATA.length - 1))));
var p = pts[i];
dot.setAttribute('cx', p[0]); dot.setAttribute('cy', p[1]); dot.style.opacity = '1';
vline.setAttribute('x1', p[0]); vline.setAttribute('x2', p[0]); vline.style.opacity = '1';
document.getElementById('acVal').textContent = DATA[i].v.toLocaleString();
document.getElementById('acMonth').textContent = DATA[i].m;
tip.textContent = DATA[i].v.toLocaleString();
tip.style.left = (p[0] / 320 * rect.width) + 'px';
tip.style.opacity = '1';
}
function onLeave() {
dot.style.opacity = '0'; vline.style.opacity = '0'; tip.style.opacity = '0';
document.getElementById('acMonth').textContent = 'hover the chart';
document.getElementById('acVal').textContent = '—';
}
function init() {
plot = document.getElementById('acPlot');
svg = plot.querySelector('.ac-svg');
dot = document.getElementById('acDot');
vline = document.getElementById('acVLine');
tip = document.getElementById('acTip');
render();
plot.addEventListener('mousemove', onMove);
plot.addEventListener('mouseleave', onLeave);
plot.addEventListener('touchmove', function (e) { onMove(e.touches[0]); }, { passive: true });
}
init();Extend with AI
Take This Snippet Further With AI
The AI prompt for this one is for Patreon supporters ($3 a month, 7 days free), along with a site with no ads. Supporters enter the passcode once and it is remembered in this browser.
What's included
Features
smooth derives Bézier control points from each point's neighbours, producing a natural curve that passes through every value.render maps values into the plot with 15% padding so the line never touches the edges and small changes stay visible.linearGradient that clips to the curve.mousemove listener snaps a dot and a dashed vertical line to the nearest point using getBoundingClientRect mapping.touchmove handler reuses the same nearest-point logic so the crosshair works on phones.preserveAspectRatio="none" stretches the viewBox to the card width; the math is resolution-independent, so no resize code.About this UI Snippet
Area Chart — Smooth Catmull-Rom Curve, Gradient Fill & Hover Crosshair
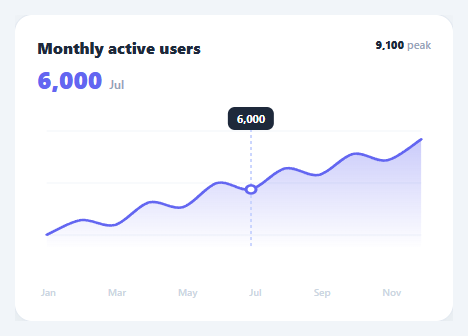
An area chart is the go-to for showing a single metric's trend over time — active users, revenue, temperature — where the filled area under the line emphasises volume and growth. This snippet draws one with an SVG <path> in HTML, CSS, and vanilla JavaScript: a smooth curve through the data points, a gradient area fill, baseline gridlines, and an interactive hover crosshair with a dot, a value readout, and a tooltip.
Smooth curve via Catmull-Rom
Straight line segments between points look jagged; a true smooth curve reads as a polished chart. The smooth function converts the data points into a cubic Bézier path using the Catmull-Rom-to-Bézier formula: for each point it derives two control points from the slope of its neighbours ((p2 - p0) / 6), producing a curve that passes through every data point while flowing naturally between them. This is the same technique charting libraries use for their "smooth"/"natural" line mode, implemented in a dozen lines.
Auto-scaled, gradient-filled area
render computes the data's min and max, adds 15% padding so the line never touches the chart edges, and maps each value into the plot area. The line path is built once with smooth; the area path reuses that exact line and closes it down to the baseline (L X1 BOT L X0 BOT Z), then fills with an SVG linearGradient that fades from translucent to transparent. Using an in-markup SVG gradient (not a CSS background) means the fill clips perfectly to the curved area and renders identically across every framework export.
Hover crosshair and readout
A mousemove listener on the plot maps the cursor's horizontal position to the nearest data index using getBoundingClientRect (so it works regardless of the chart's CSS size versus its viewBox). It then positions a marker dot on that point, draws a dashed vertical crosshair line, updates the big value/month readout in the header, and floats a small tooltip above the point. Leaving the chart hides them and resets the readout. A touchmove handler maps the same logic for mobile.
Responsive by default
preserveAspectRatio="none" lets the 320×170 viewBox stretch to the card width, and the coordinate mapping in render is resolution-independent, so the chart is fluid with no resize handling. The x-axis labels render every other month to avoid crowding on narrow screens.
Swap the DATA array for your figures and it redraws. Pair this with a realtime line chart for live streams, a stacked bar chart for composition, or a sparkline chart for compact trends.
Step by step
How to Use
- 1Paste HTML, CSS, and JSA "Monthly active users" card appears with a smooth gradient-filled area curve across twelve months and a peak readout.
- 2Hover the chartA dot snaps to the nearest month, a dashed vertical line marks it, and the header shows that month's value.
- 3Read the tooltipA small tooltip floats above the hovered point with the exact value, tracking your cursor across the months.
- 4Move along the curveAs you sweep across, the crosshair and readout update to the nearest data point in real time.
- 5On mobileDrag a finger across the chart — the same crosshair and readout follow your touch.
- 6Plug in your dataReplace the
DATAarray with your{ m, v }points; the curve auto-scales to the min/max with padding.
Real-world uses
Common Use Cases
Got questions?
Frequently Asked Questions
Replace the DATA array with your { m, v } points (any length) and call render. It recomputes the min/max with padding and remaps every point, so the curve, area, gridlines, and peak adapt automatically. For non-monthly data, just change the label field and the x-axis renderer.
Render a second line and area from another data array with its own gradient and colour, layering the paths in the SVG. Add both values to the hover tooltip. For comparison readability, give the second series a distinct hue and a slightly lower area opacity so the overlap stays legible.
Catmull-Rom produces a smooth curve that still passes through every actual data point, so values are not visually distorted — unlike a basis spline, which only approximates the points. Straight segments are accurate but jagged. Catmull-Rom is the sweet spot most dashboards use for "smooth" lines, and it is cheap to compute.
Give the SVG role="img" with an aria-label summarising the trend, and expose the underlying data as an off-screen or toggleable data table for screen-reader users. The hover readout is mouse-only, so also ensure the key figures (latest, peak) appear as real text in the header, which they do here.
In React, compute the path strings with useMemo from your data and render them in JSX; track the hovered index in useState for the crosshair, updating it in an onMouseMove. In Vue, use a computed for the paths and a ref for hover. In Angular, compute in the component and bind [attr.d]. The Catmull-Rom function and gradient port unchanged.