



Stacked Bar Chart — HTML CSS JS Snippet
Stacked Bar Chart · Charts · Plain HTML, CSS & JS · Live preview
Copy & paste
Source Code
<div class="sb-card">
  <div class="sb-head">
    <div>
      <h2 class="sb-title">Revenue by stream</h2>
      <div class="sb-sub">First half · $k</div>
    </div>
    <div class="sb-legend" id="sbLegend"></div>
  </div>
  <div class="sb-plot">
    <div class="sb-chart" id="sbChart"></div>
    <div class="sb-tip" id="sbTip"></div>
  </div>
</div>*{box-sizing:border-box;margin:0;padding:0}
body{font-family:system-ui,-apple-system,sans-serif;background:#f1f5f9;min-height:100vh;display:flex;align-items:center;justify-content:center;padding:24px}
.sb-card{background:#fff;border:1px solid #e2e8f0;border-radius:18px;padding:22px;width:100%;max-width:460px;box-shadow:0 14px 44px rgba(15,23,42,.07)}
.sb-head{display:flex;align-items:flex-start;justify-content:space-between;margin-bottom:18px}
.sb-title{font-size:17px;font-weight:800;color:#1e293b}
.sb-sub{font-size:12px;color:#94a3b8;font-weight:600;margin-top:2px}
.sb-legend{display:flex;flex-direction:column;gap:5px}
.sb-legend span{display:flex;align-items:center;gap:6px;font-size:11px;font-weight:600;color:#64748b}
.sb-key{width:10px;height:10px;border-radius:3px}
.sb-plot{position:relative}
.sb-chart{display:flex;align-items:flex-end;justify-content:space-between;gap:12px;height:200px;padding-top:10px}
.sb-col{flex:1;display:flex;flex-direction:column;align-items:center;gap:8px;cursor:pointer;height:100%;justify-content:flex-end}
.sb-stack{width:100%;max-width:42px;display:flex;flex-direction:column-reverse;border-radius:6px;overflow:hidden;transform-origin:bottom;animation:sb-grow .6s cubic-bezier(.4,0,.2,1) both;transition:filter .15s}
.sb-col:hover .sb-stack{filter:brightness(1.08)}
.sb-col.active .sb-stack{filter:brightness(1.12)}
@keyframes sb-grow{from{transform:scaleY(0)}to{transform:scaleY(1)}}
.sb-seg{display:block;width:100%}
.sb-xlabel{font-size:11px;font-weight:700;color:#94a3b8}
.sb-tip{position:absolute;bottom:46px;transform:translateX(-50%);background:#1e293b;color:#fff;border-radius:10px;padding:10px 12px;font-size:12px;min-width:130px;opacity:0;pointer-events:none;transition:opacity .15s;box-shadow:0 8px 22px rgba(0,0,0,.3);z-index:2}
.sb-tip-h{font-weight:800;margin-bottom:6px}
.sb-tip-row{display:flex;align-items:center;gap:7px;color:#cbd5e1;margin-bottom:3px}
.sb-tip-row b{margin-left:auto;color:#fff;font-variant-numeric:tabular-nums}
.sb-dot{width:8px;height:8px;border-radius:2px}
.sb-tip-total{display:flex;margin-top:6px;padding-top:6px;border-top:1px solid #475569;font-weight:800}
.sb-tip-total b{margin-left:auto;font-variant-numeric:tabular-nums}var DATA = [
{ label: 'Jan', v: [40, 28, 12] },
{ label: 'Feb', v: [52, 30, 16] },
{ label: 'Mar', v: [48, 34, 14] },
{ label: 'Apr', v: [61, 40, 20] },
{ label: 'May', v: [55, 38, 22] },
{ label: 'Jun', v: [70, 44, 26] }
];
var SERIES = [
{ name: 'Product', color: '#6366f1' },
{ name: 'Services', color: '#22c55e' },
{ name: 'Support', color: '#f59e0b' }
];
var H = 190;
var chart = document.getElementById('sbChart');
var tip = document.getElementById('sbTip');
function sum(arr) { return arr.reduce(function (a, b) { return a + b; }, 0); }
function build() {
document.getElementById('sbLegend').innerHTML = SERIES.map(function (s) {
return '<span><i class="sb-key" style="background:' + s.color + '"></i>' + s.name + '</span>';
}).join('');
var max = Math.max.apply(null, DATA.map(function (d) { return sum(d.v); }));
var html = '';
DATA.forEach(function (d, i) {
var segs = SERIES.map(function (s, si) {
var h = d.v[si] / max * H;
return '<span class="sb-seg" style="height:' + h.toFixed(1) + 'px;background:' + s.color + '"></span>';
}).join('');
html += '<div class="sb-col" data-i="' + i + '"><div class="sb-stack" style="animation-delay:' + (i * 0.07) + 's">' + segs + '</div><span class="sb-xlabel">' + d.label + '</span></div>';
});
chart.innerHTML = html;
chart.querySelectorAll('.sb-col').forEach(function (col) {
col.addEventListener('mouseenter', function () { showTip(col); });
col.addEventListener('mouseleave', hideTip);
});
}
function showTip(col) {
var d = DATA[+col.dataset.i];
tip.innerHTML = '<div class="sb-tip-h">' + d.label + '</div>' +
SERIES.map(function (s, si) {
return '<div class="sb-tip-row"><span class="sb-dot" style="background:' + s.color + '"></span>' + s.name + '<b>' + d.v[si] + '</b></div>';
}).join('') +
'<div class="sb-tip-total">Total<b>' + sum(d.v) + '</b></div>';
tip.style.left = (col.offsetLeft + col.offsetWidth / 2) + 'px';
tip.style.opacity = '1';
col.classList.add('active');
}
function hideTip() {
tip.style.opacity = '0';
chart.querySelectorAll('.sb-col').forEach(function (c) { c.classList.remove('active'); });
}
build();Extend with AI
Take This Snippet Further With AI
The AI prompt for this one is for Patreon supporters ($3 a month, 7 days free), along with a site with no ads. Supporters enter the passcode once and it is remembered in this browser.
What's included
Features
build maps each v value to value / max × H pixels, so every column shares one scale and is directly comparable.flex-direction: column-reverse stack, so the first series anchors the bottom and series pile up in order.scaleY from a bottom origin and staggered delays — proportions stay intact and it exports cleanly.offsetLeft + offsetWidth / 2 and translateX(-50%).SERIES array, so colours and names stay in sync with the bars automatically.DATA and SERIES drive the segments, legend, and tooltips — change one array, everything follows.filter: brightness so it is clear which bar the tooltip refers to.About this UI Snippet
Stacked Bar Chart — Multi-Series Segments, Hover Breakdown Tooltip & Staggered Grow-In
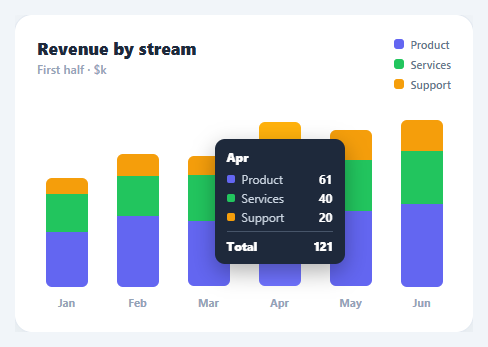
A stacked bar chart shows both the total of each category and how that total breaks down into parts — revenue by stream, traffic by source, hours by project. It is the right chart when the composition matters as much as the magnitude. This snippet builds one from a plain data array in HTML, CSS, and vanilla JavaScript: proportional stacked segments per column, an auto-generated legend, a hover tooltip with the per-series breakdown and total, and a staggered grow-in animation.
Data-driven stacking
build reads a DATA array where each entry has a label and a v array of per-series values, and a SERIES array defining each series' name and colour. It finds the maximum column total across the dataset, then for each column maps every series value to a pixel height (value / max × H) and emits a coloured segment. The segments live in a column-reverse flex stack so the first series sits at the bottom and they pile upward in series order. Because heights are derived from one shared max, every column is on the same scale and comparable at a glance.
Compositor-smooth grow-in
Each stack animates up with a sb-grow keyframe using transform: scaleY from a bottom origin, with a per-column animation-delay so the bars rise left to right. Scaling the whole stack (rather than animating each segment's height) keeps the proportions intact during the animation and runs on the GPU — and, importantly, a transform-based animation survives the Tailwind/React export cleanly, where animating raw height would not.
Hover tooltip with full breakdown
Hovering a column shows a dark tooltip listing each series with its colour swatch and value, plus the column total — the detail a stacked chart needs, since you cannot read individual segment values precisely off the axis. The tooltip is positioned by reading the hovered column's offsetLeft + offsetWidth / 2 and centring over it with a translateX(-50%), so it tracks whichever bar you are on. The hovered column brightens slightly for feedback.
Auto-generated legend
The legend is built from the SERIES array, so adding or recolouring a series updates the chart, the segments, and the legend together from one source of truth. There is nothing to keep in sync by hand.
Swap the DATA and SERIES arrays for your real figures and the chart redraws. Pair this with a bar chart for single-series data, an area chart for trends over time, or a metric card grid for headline KPIs.
Step by step
How to Use
- 1Paste HTML, CSS, and JSA "Revenue by stream" card appears; six stacked bars (Jan–Jun) grow up from the baseline with a legend of three series.
- 2Read the compositionEach bar stacks Product, Services, and Support segments, so you see both the monthly total and its breakdown.
- 3Hover a barA tooltip shows each series with its value and the column total, positioned centred over the bar you are on.
- 4Watch the staggerOn load the bars rise left to right via a scaleY animation, drawing the eye across the time axis.
- 5Recolour or add a seriesEdit the
SERIESarray — the legend, segments, and tooltip all update from it. - 6Plug in your dataReplace
DATAwith your own{ label, v: [...] }entries; heights auto-scale to the largest column total.
Real-world uses
Common Use Cases
Got questions?
Frequently Asked Questions
Replace the DATA array with your entries ({ label, v: [series1, series2, ...] }) and the SERIES array with your series names and colours — keep the v order matching SERIES. build recomputes the max column total and rescales every segment, so the chart adapts to any values and any number of columns or series.
For grouped (side-by-side) bars, render each series as its own thin bar within the column instead of stacking them, scaling by the max single value rather than the max total. Many dashboards offer a toggle: keep both render paths and swap based on a button, since stacked answers "what's the composition" and grouped answers "how do series compare".
Scale each segment by its share of that column's own total instead of the global max: value / columnTotal × H, so every bar fills the full height and shows proportions rather than absolute magnitude. This is ideal when you care about mix shift over time, not raw totals.
The bars are decorative <div>s, so expose the data textually: add an aria-label to each column summarising it ("June: Product 70, Services 44, Support 26, total 140"), give the chart a role="img" with an overall label, and consider an off-screen data table for screen-reader users. Ensure series are distinguishable beyond colour (the legend and tooltip provide names).
In React, compute the segment heights with useMemo from your data and render columns/segments as styled <div>s; hold the hovered index in useState for the tooltip — no manual DOM building. In Vue, use v-for with :style and a ref for the hovered column. In Angular, *ngFor with [style.height]. The scaleY keyframe and stacking CSS port unchanged.