

Interact.js Draggable and Resizable Dashboard Panels with Snapping
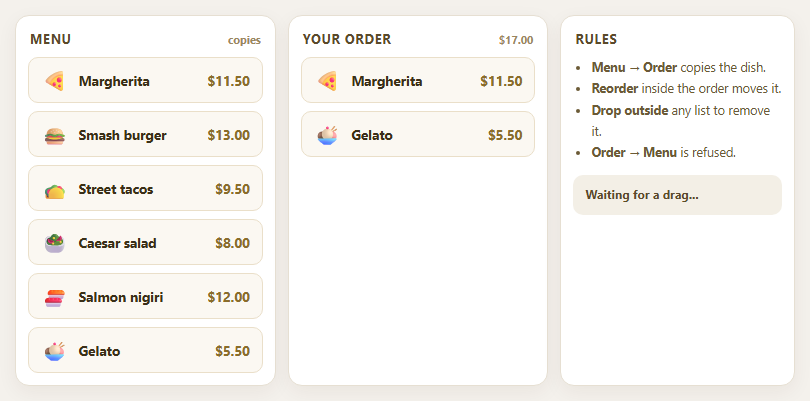
Dragula Copy vs Move Lists with Spill Control

SortableJS Shared Groups: Clone from a Palette into a Page Builder

SortableJS Drag Handle with Pinned and Locked Rows
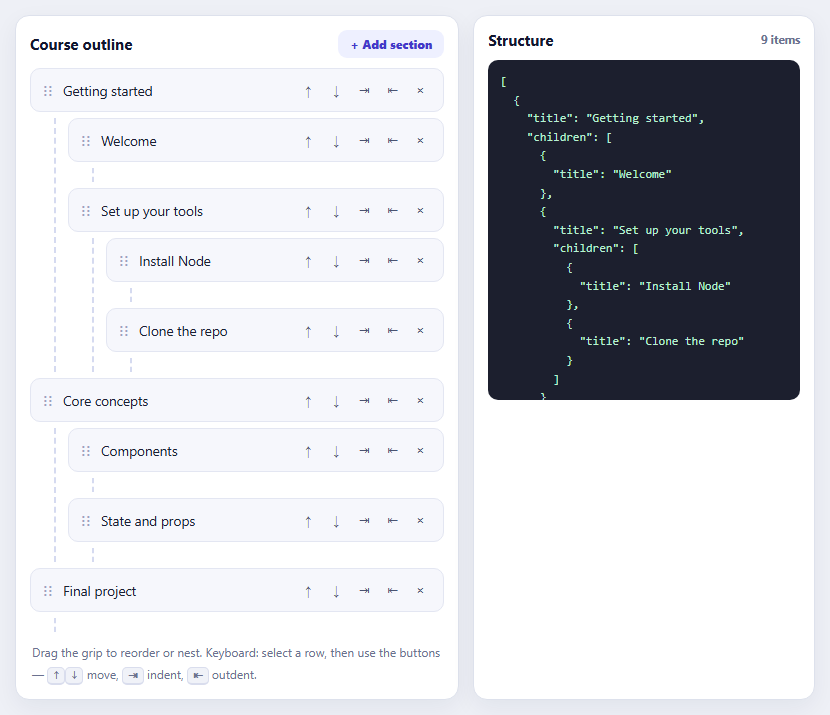
SortableJS Nested Sortable Tree with Keyboard Controls
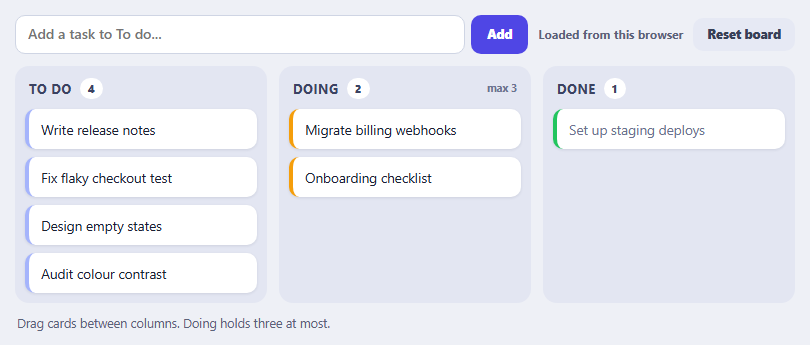
SortableJS Multi-List Kanban with Persistence and WIP Limit
Dashboard Layout — Free HTML CSS Admin Snippet
Dashboard Layout · Dashboards · Plain HTML & CSS · Live preview
Copy & paste
Source Code
<div class="app">
  <aside class="sidebar">
    <div class="logo">◈ Dash</div>
    <nav>
      <a href="#" class="link active">
        <svg width="15" height="15" viewBox="0 0 24 24" fill="none" stroke="currentColor" stroke-width="2"><rect x="3" y="3" width="7" height="7"/><rect x="14" y="3" width="7" height="7"/><rect x="3" y="14" width="7" height="7"/><rect x="14" y="14" width="7" height="7"/></svg>
        Overview
      </a>
      <a href="#" class="link">
        <svg width="15" height="15" viewBox="0 0 24 24" fill="none" stroke="currentColor" stroke-width="2" stroke-linecap="round"><polyline points="22 12 18 12 15 21 9 3 6 12 2 12"/></svg>
        Analytics
      </a>
      <a href="#" class="link">
        <svg width="15" height="15" viewBox="0 0 24 24" fill="none" stroke="currentColor" stroke-width="2" stroke-linecap="round"><path d="M17 21v-2a4 4 0 0 0-4-4H5a4 4 0 0 0-4 4v2"/><circle cx="9" cy="7" r="4"/></svg>
        Users
        <span class="badge">12</span>
      </a>
      <a href="#" class="link">
        <svg width="15" height="15" viewBox="0 0 24 24" fill="none" stroke="currentColor" stroke-width="2" stroke-linecap="round"><line x1="12" y1="1" x2="12" y2="23"/><path d="M17 5H9.5a3.5 3.5 0 0 0 0 7h5a3.5 3.5 0 0 1 0 7H6"/></svg>
        Billing
      </a>
    </nav>
  </aside>
  <div class="main">
    <header class="topbar">
      <div class="page-title">Overview</div>
      <div class="topbar-right">
        <div class="search"><svg width="13" height="13" viewBox="0 0 24 24" fill="none" stroke="currentColor" stroke-width="2.5" stroke-linecap="round"><circle cx="11" cy="11" r="8"/><line x1="21" y1="21" x2="16.65" y2="16.65"/></svg><input placeholder="Search…" /></div>
        <div class="user-dot">PS</div>
      </div>
    </header>
    <div class="content">
      <div class="metric-grid">
        <div class="metric"><span class="m-val">$24.8k</span><span class="m-key">Revenue</span><span class="m-trend up">↑ 12%</span></div>
        <div class="metric"><span class="m-val">1,284</span><span class="m-key">Users</span><span class="m-trend up">↑ 8%</span></div>
        <div class="metric"><span class="m-val">98.2%</span><span class="m-key">Uptime</span><span class="m-trend up">↑ 0.1%</span></div>
        <div class="metric"><span class="m-val">42ms</span><span class="m-key">Avg Response</span><span class="m-trend down">↑ 3ms</span></div>
      </div>
      <div class="chart-placeholder">
        <div class="chart-label">Revenue — last 7 days</div>
        <div class="bars">
          <div class="bar" style="--h:40%">Mon</div>
          <div class="bar" style="--h:65%">Tue</div>
          <div class="bar" style="--h:55%">Wed</div>
          <div class="bar" style="--h:80%">Thu</div>
          <div class="bar" style="--h:72%">Fri</div>
          <div class="bar" style="--h:45%">Sat</div>
          <div class="bar active" style="--h:90%">Sun</div>
        </div>
      </div>
    </div>
  </div>
</div>
* { box-sizing: border-box; margin: 0; padding: 0; }
body { font-family: system-ui, sans-serif; background: #f1f5f9; }
.app { display: flex; height: 100vh; }
.sidebar { width: 180px; background: #1e293b; display: flex; flex-direction: column; gap: 20px; padding: 18px 12px; flex-shrink: 0; }
.logo { font-size: 16px; font-weight: 800; color: #f1f5f9; padding: 0 8px; }
nav { display: flex; flex-direction: column; gap: 2px; }
.link { display: flex; align-items: center; gap: 8px; padding: 8px 10px; font-size: 12px; font-weight: 500; color: #64748b; text-decoration: none; border-radius: 7px; transition: all 0.1s; }
.link:hover { background: #334155; color: #f1f5f9; }
.link.active { background: #334155; color: #f1f5f9; font-weight: 600; }
.link .badge { margin-left: auto; background: #6366f1; color: #fff; font-size: 9px; font-weight: 700; padding: 1px 5px; border-radius: 8px; }
.main { flex: 1; display: flex; flex-direction: column; overflow: hidden; }
.topbar { display: flex; align-items: center; justify-content: space-between; padding: 0 20px; height: 50px; background: #fff; border-bottom: 1px solid #e2e8f0; flex-shrink: 0; }
.page-title { font-size: 14px; font-weight: 700; color: #1e293b; }
.topbar-right { display: flex; align-items: center; gap: 10px; }
.search { display: flex; align-items: center; gap: 6px; background: #f8fafc; border: 1px solid #e2e8f0; border-radius: 7px; padding: 0 10px; height: 30px; }
.search input { border: none; outline: none; font-size: 12px; background: transparent; color: #1e293b; width: 120px; font-family: inherit; }
.user-dot { width: 28px; height: 28px; border-radius: 50%; background: linear-gradient(135deg,#6366f1,#8b5cf6); color: #fff; font-size: 10px; font-weight: 700; display: flex; align-items: center; justify-content: center; }
.content { flex: 1; overflow-y: auto; padding: 20px; display: flex; flex-direction: column; gap: 16px; }
.metric-grid { display: grid; grid-template-columns: repeat(4,1fr); gap: 12px; }
.metric { background: #fff; border-radius: 12px; padding: 16px; display: flex; flex-direction: column; gap: 4px; border: 1px solid #e2e8f0; }
.m-val { font-size: 20px; font-weight: 800; color: #1e293b; }
.m-key { font-size: 11px; color: #94a3b8; }
.m-trend { font-size: 11px; font-weight: 600; }
.m-trend.up { color: #16a34a; }
.m-trend.down { color: #dc2626; }
.chart-placeholder { background: #fff; border-radius: 12px; padding: 18px; border: 1px solid #e2e8f0; }
.chart-label { font-size: 12px; font-weight: 600; color: #64748b; margin-bottom: 16px; }
.bars { display: flex; align-items: flex-end; gap: 8px; height: 120px; }
.bar { flex: 1; background: #e2e8f0; border-radius: 6px 6px 0 0; height: var(--h); display: flex; align-items: flex-end; justify-content: center; padding-bottom: -20px; font-size: 9px; color: #94a3b8; position: relative; transition: background 0.15s; }
.bar::after { content: attr(data-label); position: absolute; bottom: -18px; font-size: 9px; color: #94a3b8; white-space: nowrap; }
.bar.active { background: #6366f1; }Extend with AI
Take This Snippet Further With AI
The AI prompt for this one is for Patreon supporters ($3 a month), along with a site with no ads. Supporters enter the passcode once and it is remembered in this browser.
What's included
Features
About this UI Snippet
Dashboard Layout — Flex App Shell, Fixed Sidebar & Content Grid
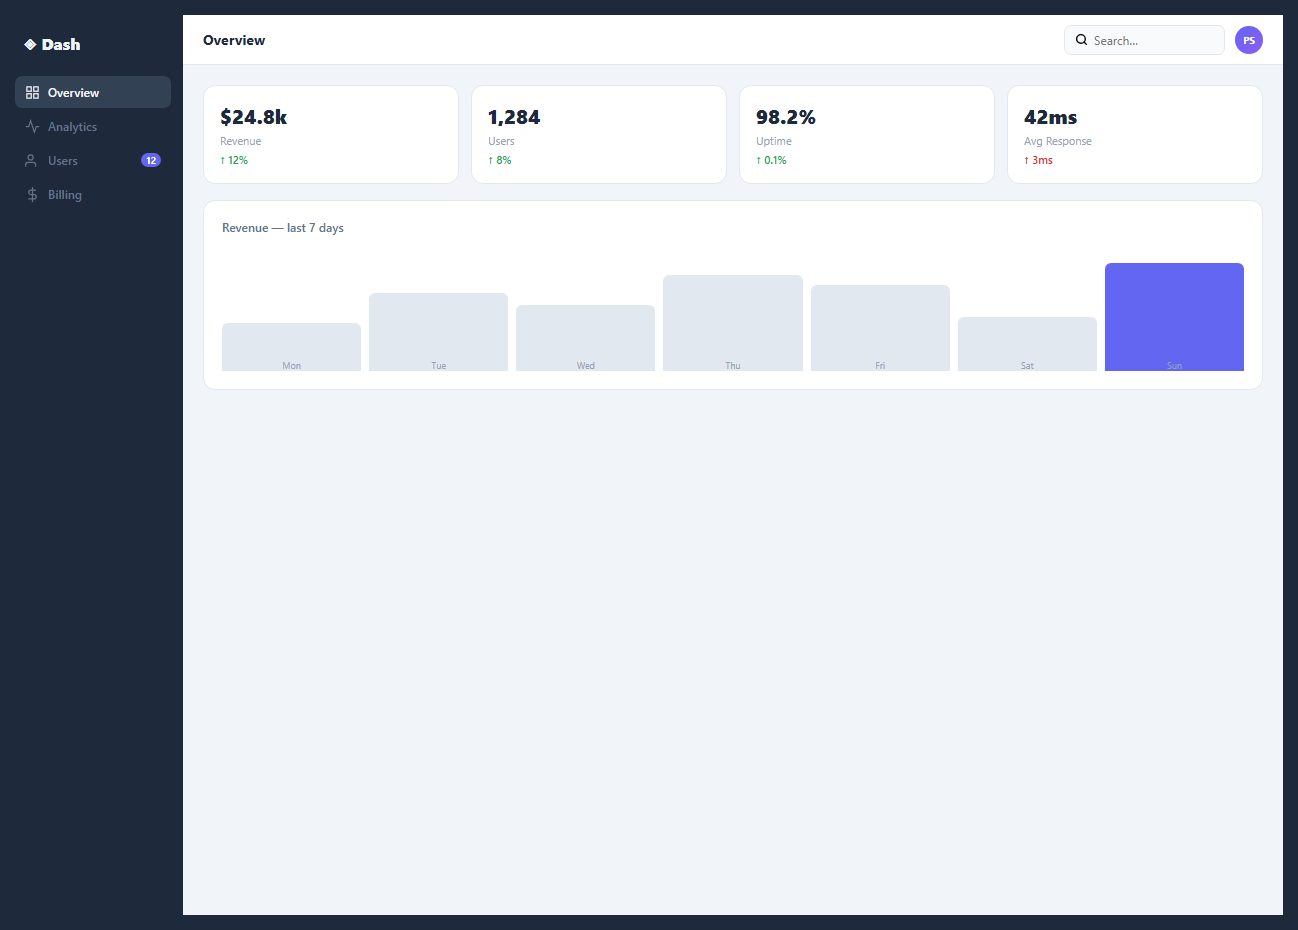
A dashboard layout is the foundational structure of any admin panel, analytics tool, or SaaS application. This snippet provides a complete dashboard frame: a fixed sidebar, a scrollable main content area, a stats cards row, and a data table.
The flex app shell
.app { display: flex; height: 100vh } creates the full-height application frame. The sidebar has a fixed width: 180px and flex-shrink: 0. The main content has flex: 1; overflow-y: auto — it fills all remaining space and scrolls independently of the sidebar.
The stats cards row
Four stats cards use display: grid; grid-template-columns: repeat(4, 1fr) for equal-width distribution. Each card shows an icon, label, value, and change indicator.
The data table
A standard <table> with border-collapse: collapse and alternating row backgrounds communicates tabular data clearly. The status column uses coloured badge chips identical to the Badges & Chips snippet.
The sidebar navigation
The sidebar contains a brand logo, navigation links with icons, and a user profile section at the bottom. Each nav link uses a flex row with icon + label. The active link has background: rgba(accent,0.12) and accent-coloured text. The sidebar uses overflow-y: auto so long nav lists scroll without pushing the user profile off screen.
Responsive behaviour
On mobile, the sidebar should be hidden by default and toggled via a hamburger button. Add @media (max-width: 768px) { .sidebar { position: fixed; left: -180px; transition: left 0.3s; } .sidebar.open { left: 0; } .main { margin-left: 0; } }. A hamburger button in the header calls sidebar.classList.toggle("open").
The stats grid
Four metric cards use display: grid; grid-template-columns: repeat(4, 1fr). Each card has an icon, metric value, label, and change indicator. The change uses green for positive and red for negative. This pattern is from the Stats Card snippet in this library — wire to real data by updating the value and change fields from your API response.
Extending the layout
Drop any snippet from this library into the .main content area. The area scrolls independently, so content of any length works without affecting the sidebar or header. Add a .tabs nav inside the main header for sub-page navigation within the dashboard section.
Step by step
How to Use
- 1Load the snippetClick "Dashboard Layout" in the sidebar. The preview shows the full app shell: dark sidebar, stats row, and data table.
- 2Update sidebar nav linksIn the HTML panel, change the sidebar link labels and SVG icons.
- 3Update stats card valuesChange the metric values, labels, and change percentages in the four stats cards.
- 4Update table dataReplace the table rows with your own data. Update column headers and row content.
- 5Change sidebar widthUpdate width: 180px on .sidebar in the CSS panel to adjust the sidebar size.
- 6Export in your formatClick "HTML" for a standalone file, "JSX" for a React component, or "Tailwind" for a React + Tailwind version.
Real-world uses
Common Use Cases
Got questions?
Frequently Asked Questions
The .app container is display: flex; height: 100vh. The .sidebar has flex-shrink: 0 (prevents compression) and its own height: 100vh with overflow-y: auto. The .main has flex: 1; overflow-y: auto. Both fill full height; the main area scrolls independently while the sidebar stays pinned.
Toggle a .collapsed class on the sidebar. CSS .sidebar.collapsed { width: 48px } collapses it to icon-only. Add overflow: hidden and hide the text labels with .collapsed .nav-label { display: none }. The main content expands into the freed space automatically via flex.
Add @media (max-width: 768px) { .sidebar { position: fixed; left: -180px; transition: left 0.3s; z-index: 100; } .sidebar.open { left: 0 } .app { padding-left: 0 } }. Add a hamburger button that toggles .open. An overlay behind the sidebar closes it on tap.
Yes. Create a Layout component that wraps all pages. The Sidebar component manages its own collapsed state. In Next.js, use the App Router layout.js to wrap all routes: export default function RootLayout({ children }) { return <div className="app"><Sidebar /><main>{children}</main></div> }
Add a .topbar element inside .main before .content. Give it position: sticky; top: 0; z-index: 10; background: #fff. Because .main uses overflow-y: auto, sticky positioning is scoped to the main scroll container — it pins to the top of the main area, not the viewport.
After your API fetch resolves, update each stat: const stats = await fetch("/api/stats").then(r => r.json()); document.getElementById("stat-revenue").textContent = "$" + stats.revenue.toLocaleString(). In React, store API data in useState and pass values as props to StatsCard components.