
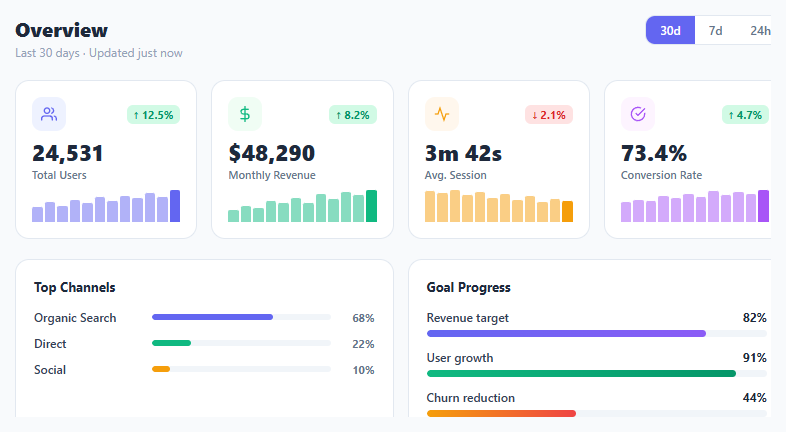
Metric KPI Card Grid

Interact.js Draggable and Resizable Dashboard Panels with Snapping
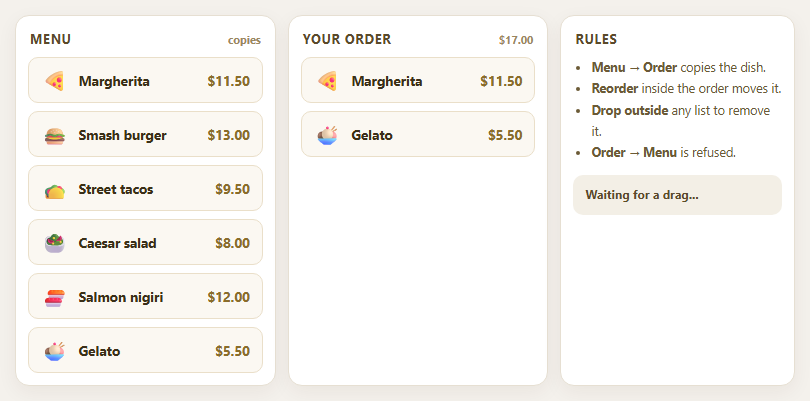
Dragula Copy vs Move Lists with Spill Control

SortableJS Shared Groups: Clone from a Palette into a Page Builder

SortableJS Drag Handle with Pinned and Locked Rows
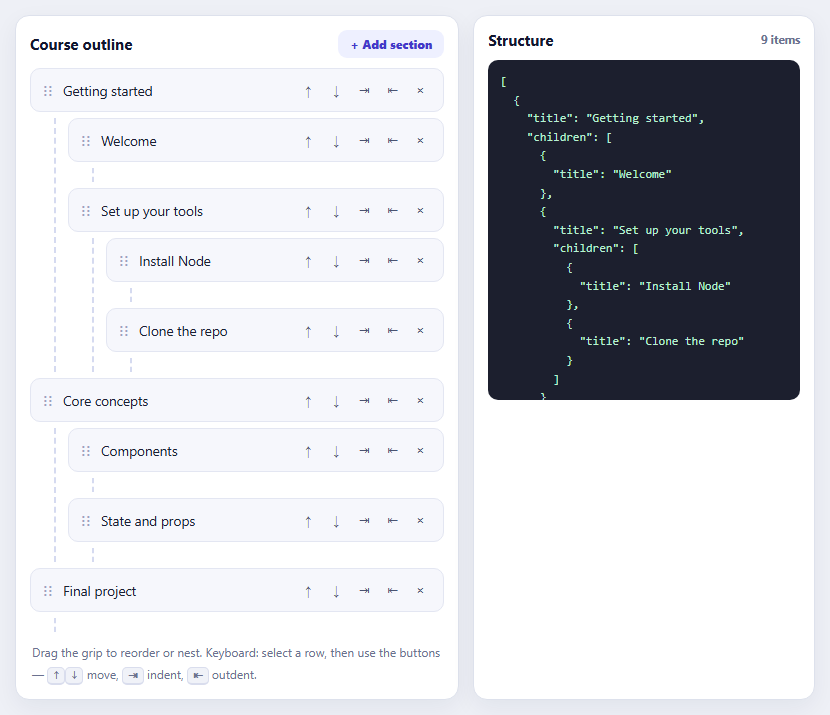
SortableJS Nested Sortable Tree with Keyboard Controls
Stats Card — Free HTML CSS JS Count-Up Snippet
Stats Card · Dashboards · Plain HTML, CSS & JS · Live preview
Copy & paste
Source Code
<div class="grid">
  <div class="card">
    <div class="icon" style="background:rgba(99,102,241,0.1);color:#6366f1">
      <svg width="18" height="18" viewBox="0 0 24 24" fill="none" stroke="currentColor" stroke-width="2"><path d="M17 21v-2a4 4 0 0 0-4-4H5a4 4 0 0 0-4 4v2"/><circle cx="9" cy="7" r="4"/><path d="M23 21v-2a4 4 0 0 0-3-3.87"/><path d="M16 3.13a4 4 0 0 1 0 7.75"/></svg>
    </div>
    <div class="value" data-target="24891">0</div>
    <div class="label">Total Users</div>
    <div class="change up">↑ 12% this month</div>
  </div>
  <div class="card">
    <div class="icon" style="background:rgba(16,185,129,0.1);color:#10b981">
      <svg width="18" height="18" viewBox="0 0 24 24" fill="none" stroke="currentColor" stroke-width="2"><line x1="12" y1="1" x2="12" y2="23"/><path d="M17 5H9.5a3.5 3.5 0 0 0 0 7h5a3.5 3.5 0 0 1 0 7H6"/></svg>
    </div>
    <div class="value" data-target="84320">0</div>
    <div class="label">Revenue</div>
    <div class="change up">↑ 8.2% this month</div>
  </div>
  <div class="card">
    <div class="icon" style="background:rgba(245,158,11,0.1);color:#f59e0b">
      <svg width="18" height="18" viewBox="0 0 24 24" fill="none" stroke="currentColor" stroke-width="2"><polyline points="22 12 18 12 15 21 9 3 6 12 2 12"/></svg>
    </div>
    <div class="value" data-target="3.4">0</div>
    <div class="label">Avg Session (min)</div>
    <div class="change down">↓ 2.1% this week</div>
  </div>
</div>
* { box-sizing: border-box; margin: 0; padding: 0; }
body { font-family: system-ui, sans-serif; background: #f8fafc; display: flex; align-items: center; justify-content: center; min-height: 100vh; padding: 20px; }
.grid { display: flex; flex-wrap: wrap; gap: 14px; justify-content: center; }
.card {
background: #fff; border-radius: 14px; padding: 20px; width: 180px;
border: 1px solid #e2e8f0; box-shadow: 0 2px 10px rgba(0,0,0,0.05);
}
.icon { width: 40px; height: 40px; border-radius: 10px; display: flex; align-items: center; justify-content: center; margin-bottom: 14px; }
.value { font-size: 26px; font-weight: 800; color: #1e293b; line-height: 1; margin-bottom: 4px; }
.label { font-size: 12px; color: #64748b; margin-bottom: 8px; }
.change { font-size: 11px; font-weight: 600; }
.change.up { color: #16a34a; }
.change.down { color: #dc2626; }function animateValue(el) {
const target = parseFloat(el.dataset.target);
const isDecimal = target % 1 !== 0;
const start = performance.now();
(function frame(now) {
const p = Math.min((now - start) / 1200, 1);
const val = target * (1 - Math.pow(1 - p, 3));
el.textContent = isDecimal ? val.toFixed(1) : Math.floor(val).toLocaleString();
if (p < 1) requestAnimationFrame(frame);
})(performance.now());
}
document.querySelectorAll('[data-target]').forEach(el => {
const obs = new IntersectionObserver(([e]) => { if (e.isIntersecting) { animateValue(el); obs.disconnect(); } });
obs.observe(el);
});Extend with AI
Take This Snippet Further With AI
The AI prompt for this one is for Patreon supporters ($3 a month), along with a site with no ads. Supporters enter the passcode once and it is remembered in this browser.
What's included
Features
About this UI Snippet
Stats Card — IntersectionObserver Count-Up, requestAnimationFrame Easing & Change Indicators

Stats cards display key metrics — revenue, user count, conversion rate, active sessions. They appear on every analytics dashboard, SaaS overview page, and marketing landing section. The difference between a static number and an animated count-up is significant: the animation draws the eye to the metric at the moment it enters the viewport, making the number feel earned rather than just displayed.
The IntersectionObserver trigger
Each .value element has a data-target attribute with the final number. The JavaScript creates an IntersectionObserver for each element. When the element enters the viewport (e.isIntersecting), animateValue(el) is called and the observer disconnects — the animation runs once and does not re-trigger on scroll back.
The count-up animation
animateValue(el) uses performance.now() as the animation start time and requestAnimationFrame for smooth updates. Each frame calculates progress p = Math.min((now - start) / 1200, 1) — a value from 0 to 1 over 1200ms. The easing function 1 - Math.pow(1 - p, 3) is a cubic ease-out: it starts fast and decelerates near the final value, like a car slowing to a stop. The eased progress multiplied by the target gives the current display value. For decimal targets, toFixed(1) is used; for integers, toLocaleString() adds commas.
Change indicators
Each card has a .change span with .up (green) or .down (red) and a delta value. The up/down classes control colour only — the emoji arrow is in the HTML. This makes it straightforward to wire real data: compare current vs previous period and set the class and delta dynamically.
Coloured icon backgrounds
Each card has an icon in a square with a coloured rounded background (.icon) tinted to match the metric type — purple for revenue, blue for users, green for conversion. Update the background and color inline styles on each .icon div to match your own metric categories.
The IntersectionObserver single-fire pattern
The stats card uses IntersectionObserver with threshold: 0.5. When 50% of the card enters the viewport, the count-up animation fires. Inside the callback, obs.disconnect() immediately unregisters the observer — the animation plays exactly once per page load, never re-triggering when the user scrolls back. This is the correct pattern for "animate once on enter" — not "animate every time on enter/exit".
The activity heatmap grid
The contribution heatmap generates a grid of day cells using JavaScript: for (let week = 0; week < 52; week++) { for (let day = 0; day < 7; day++) { ... } }. Each cell gets a colour intensity class based on its activity value (0–4). The CSS uses different background opacity levels per intensity class. The grid uses display: grid; grid-template-columns: repeat(52, auto); gap: 2px — 52 columns for 52 weeks.
SVG progress rings
The stats card uses multiple SVG progress rings at different sizes. Each ring has its own CIRCUMFERENCE (2πr) and target dashoffset. The rings animate simultaneously when the card enters the viewport — all starting from their empty state (dashoffset = CIRCUMFERENCE) and transitioning to their target value over 1s.
Step by step
How to Use
- 1Scroll in the previewThe count-up animation fires when each card enters the viewport. Scroll to see the numbers count up from zero with cubic-ease deceleration.
- 2Update metric valuesIn the HTML panel, change the data-target attribute on each .value span to your real metric. The JS reads it automatically.
- 3Update labels and change indicatorsChange the .label text and the .change delta. Add class="up" for positive changes and class="down" for negative.
- 4Change icon coloursUpdate the background colour on each .icon div inline style to match your metric category colours.
- 5Adjust animation durationIn the JS panel, change 1200 (milliseconds) to speed up or slow down the count-up.
- 6Export in your formatClick "HTML" for a standalone file, "JSX" for a React component, or "Tailwind" for a React + Tailwind version.
Real-world uses
Common Use Cases
Got questions?
Frequently Asked Questions
animateValue() records the start time with performance.now(). Each requestAnimationFrame calculates p = Math.min((now - start) / 1200, 1) — progress from 0 to 1 over 1200ms. A cubic ease-out function (1 - Math.pow(1-p, 3)) applies deceleration. The eased value multiplied by the target gives the current number to display.
Scroll events fire dozens of times per second and require manual threshold calculation. IntersectionObserver fires once when the element crosses the threshold. obs.disconnect() after the first fire ensures the animation runs exactly once, even if the user scrolls back up.
Change the data-target attribute on each .value span in the HTML panel. The JS reads el.dataset.target as a float. For decimals (like 4.9), the animation uses toFixed(1). For integers, it uses toLocaleString() for comma formatting.
Copy a .card div and paste it in the HTML. Update the icon, data-target, label, and change values. The JS querySelectorAll("[data-target]") picks up any new elements automatically.
Fetch your metrics from an API and set each .value element's data-target attribute dynamically: el.dataset.target = yourValue. Then call animateValue(el) directly, or re-observe after the fetch if the cards are already in the viewport.
Yes. Click "JSX" to download a React component. In React, use a useRef on each value element and a useEffect with an IntersectionObserver. The count-up logic is identical — just wrap it in the effect callback and clean up the observer on unmount.