



Funnel Chart — Conversion Funnel HTML CSS JS Snippet
Funnel Chart · Charts · Plain HTML, CSS & JS · Live preview
Copy & paste
Source Code
<div class="fn-card">
<div class="fn-head">
<h2 class="fn-title">Conversion funnel</h2>
<span class="fn-sub">Last 30 days</span>
</div>
<div class="fn-chart" id="fnChart">
<div class="fn-stage" style="--w:100%;--c1:#6366f1;--c2:#4f46e5" onclick="focusStage(this)">
<div class="fn-bar"><span class="fn-name">Visitors</span><span class="fn-count">12,000</span></div>
<div class="fn-rate"><span class="fn-pct">100%</span><span class="fn-drop"> </span></div>
</div>
<div class="fn-stage" style="--w:43%;--c1:#7c83f4;--c2:#6366f1" onclick="focusStage(this)">
<div class="fn-bar"><span class="fn-name">Sign-ups</span><span class="fn-count">5,200</span></div>
<div class="fn-rate"><span class="fn-pct">43%</span><span class="fn-drop">−57%</span></div>
</div>
<div class="fn-stage" style="--w:26%;--c1:#8b5cf6;--c2:#7c3aed" onclick="focusStage(this)">
<div class="fn-bar"><span class="fn-name">Activated</span><span class="fn-count">3,100</span></div>
<div class="fn-rate"><span class="fn-pct">60%</span><span class="fn-drop">−40%</span></div>
</div>
<div class="fn-stage" style="--w:14%;--c1:#a855f7;--c2:#9333ea" onclick="focusStage(this)">
<div class="fn-bar"><span class="fn-name">Subscribed</span><span class="fn-count">1,450</span></div>
<div class="fn-rate"><span class="fn-pct">47%</span><span class="fn-drop">−53%</span></div>
</div>
<div class="fn-stage" style="--w:9%;--c1:#d946ef;--c2:#c026d3" onclick="focusStage(this)">
<div class="fn-bar"><span class="fn-name">Renewed</span><span class="fn-count">870</span></div>
<div class="fn-rate"><span class="fn-pct">60%</span><span class="fn-drop">−40%</span></div>
</div>
</div>
<div class="fn-foot">Overall conversion <strong>7.25%</strong> · click a stage to focus</div>
</div>*{box-sizing:border-box;margin:0;padding:0}
body{font-family:system-ui,-apple-system,sans-serif;background:#f1f5f9;min-height:100vh;display:flex;align-items:center;justify-content:center;padding:24px}
.fn-card{background:#fff;border:1px solid #e2e8f0;border-radius:18px;padding:24px;width:100%;max-width:440px;box-shadow:0 14px 44px rgba(15,23,42,.07)}
.fn-head{display:flex;align-items:baseline;justify-content:space-between;margin-bottom:20px}
.fn-title{font-size:17px;font-weight:800;color:#1e293b}
.fn-sub{font-size:12px;color:#94a3b8;font-weight:600}
.fn-chart{display:flex;flex-direction:column;gap:9px}
.fn-stage{display:flex;align-items:center;gap:12px;cursor:pointer;transition:opacity .25s}
.fn-stage.dim{opacity:.32}
.fn-stage.active .fn-bar{box-shadow:0 0 0 2px #fff,0 0 0 4px var(--c2),0 8px 18px rgba(99,102,241,.3)}
.fn-bar{position:relative;height:48px;width:var(--w);min-width:120px;margin:0 auto;border-radius:11px;background:linear-gradient(90deg,var(--c1),var(--c2));display:flex;align-items:center;justify-content:space-between;padding:0 14px;color:#fff;overflow:hidden;animation:fn-grow .8s cubic-bezier(.4,0,.2,1) both;transition:box-shadow .2s}
.fn-stage:nth-child(1) .fn-bar{animation-delay:.05s}
.fn-stage:nth-child(2) .fn-bar{animation-delay:.15s}
.fn-stage:nth-child(3) .fn-bar{animation-delay:.25s}
.fn-stage:nth-child(4) .fn-bar{animation-delay:.35s}
.fn-stage:nth-child(5) .fn-bar{animation-delay:.45s}
@keyframes fn-grow{from{width:0;opacity:0}to{width:var(--w);opacity:1}}
.fn-name{font-size:13px;font-weight:700;white-space:nowrap}
.fn-count{font-size:13px;font-weight:800;font-variant-numeric:tabular-nums;white-space:nowrap;margin-left:10px}
.fn-rate{width:74px;flex-shrink:0;text-align:right;display:flex;flex-direction:column;line-height:1.25}
.fn-pct{font-size:14px;font-weight:800;color:#1e293b;font-variant-numeric:tabular-nums}
.fn-drop{font-size:10px;font-weight:700;color:#ef4444;min-height:12px}
.fn-foot{margin-top:18px;padding-top:14px;border-top:1px solid #f1f5f9;font-size:12px;color:#64748b}
.fn-foot strong{color:#6366f1;font-weight:800}function focusStage(el) {
var stages = el.parentElement.querySelectorAll('.fn-stage');
var wasActive = el.classList.contains('active');
stages.forEach(function (s) { s.classList.remove('active', 'dim'); });
if (!wasActive) {
el.classList.add('active');
stages.forEach(function (s) { if (s !== el) s.classList.add('dim'); });
}
}Extend with AI
Take This Snippet Further With AI
The AI prompt for this one is for Patreon supporters ($3 a month, 7 days free), along with a site with no ads. Supporters enter the passcode once and it is remembered in this browser.
What's included
Features
--w custom property and centred with margin: 0 auto, forming the tapering funnel with no SVG or clip-path.min-width keeps even the narrowest stage wide enough to show its label and count, so the funnel base stays legible.fn-grow keyframe animates each bar from zero to var(--w) with nth-child delays, so the funnel pours in top to bottom.var(--w) lets one keyframe rule drive every stage regardless of its target width — no per-bar animation needed.focusStage rings the selected bar and dims the rest, then clears on a second click — built from two classes and one function.--c1/--c2 for its own gradient, giving the funnel a cohesive hue progression down the steps.About this UI Snippet
Funnel Chart — Centred Tapering Bars, Stage Conversion Rates & Drop-Off Indicators
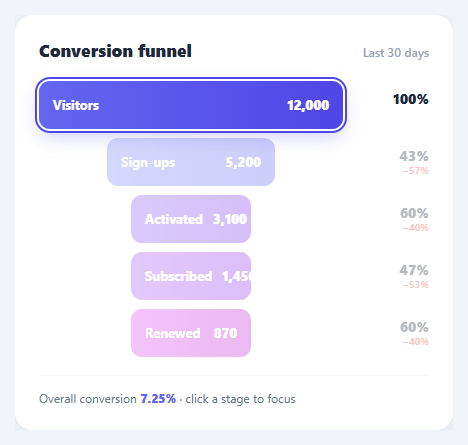
A funnel chart is the clearest way to show how users fall away across the steps of a process — visitors to sign-ups to activated to subscribed. Each stage is narrower than the last, and the shrinking width makes drop-off impossible to miss. This snippet implements a clean, animated funnel in plain HTML, CSS, and vanilla JavaScript: centred tapering bars sized by value, per-stage conversion and drop-off percentages, a staggered grow-in animation on load, and click-to-focus highlighting.
The funnel shape from centred bars
Each stage is a bar whose width is its value as a percentage of the top stage, set via a --w custom property and centred with margin: 0 auto. Because every bar is centred and each is narrower than the one above, the stack naturally forms the symmetric tapering funnel silhouette — no SVG polygons or clip-paths needed. A min-width guarantees even the smallest stage stays wide enough to hold its label and count, so the bottom of the funnel never becomes unreadable.
Two rates per stage: conversion and drop-off
Funnels are only useful if they quantify the fall-off. To the right of each bar, this snippet shows two figures: the step conversion rate (what fraction of the previous stage advanced) and the drop-off below it in red (the percentage lost). Seeing "47%" advance and "−53%" lost on the Subscribed row tells the story at a glance and points analysts straight at the leakiest step. A footer shows the overall end-to-end conversion.
Staggered grow-in animation
On load, each bar animates from width: 0 to its --w target with an fn-grow keyframe, and nth-child animation delays stagger the stages so the funnel "pours" in from top to bottom. The keyframe animates to var(--w), so the same rule works for every stage regardless of its target width. This entrance is what turns a static bar list into a chart that feels alive — and it draws the eye down the funnel in the order the steps actually happen.
Click-to-focus
focusStage adds interactivity: clicking a stage highlights it with a ring and dims the others, so you can isolate one step while presenting. Clicking the same stage again clears the focus. It is a toggle built from two classes — .active on the chosen bar and .dim on the rest — driven by one function, so it stays predictable.
The whole chart is data-light: change a stage's --w, label, count, and rate text to plug in real numbers, or render the stages from an array. Pair this funnel with a bar chart for category breakdowns, a metric card grid for headline KPIs, or a sparkline chart for trends.
Step by step
How to Use
- 1Paste HTML, CSS, and JSA "Conversion funnel" card appears and five centred bars (Visitors → Renewed) grow in from top to bottom, forming a tapering funnel.
- 2Read the stagesEach bar shows its name and count; its width is proportional to the top stage, so the narrowing visualises drop-off.
- 3Check conversion and lossTo the right of each bar, the step conversion rate sits above the red drop-off percentage (e.g. 47% advanced, −53% lost).
- 4Click a stageClick any bar — it highlights with a ring and the others dim, letting you focus a single step. Click it again to clear.
- 5See overall conversionThe footer shows the end-to-end rate (7.25%), the fraction of visitors who reached the final stage.
- 6Plug in real dataEdit each stage's
--w, label, count, and rate text — or render the stages from your analytics array.
Real-world uses
Common Use Cases
Got questions?
Frequently Asked Questions
Loop your stages array and build each .fn-stage, setting --w to value / stages[0].value * 100 + '%', the count text, and the rate. Compute the step conversion as value / prev.value and the drop-off as 1 − that. Keeping --w relative to the first stage is what produces the correct funnel proportions.
Centring each progressively-narrower bar creates the symmetric funnel silhouette that users instantly recognise as a conversion funnel. Left-aligned bars of decreasing width read as a plain bar chart instead. The margin: 0 auto centring is the single rule that turns bars into a funnel.
Add another line in the .fn-rate column with the lost count (prev.value − value), e.g. "−6,800 users". Many analysts want both the rate and the raw number, since a high percentage on a small stage can matter less than a small percentage on a huge one.
The bars are decorative, so expose the data textually: each stage already shows its name, count, and rate in real text. Add an aria-label per stage summarising it ("Sign-ups: 5,200, 43% of visitors"), and consider an off-screen data table for screen-reader users. Make focusable stages real buttons if click-to-focus is a primary interaction.
In React, map a stages array to bars, compute --w and rates with useMemo, and store the focused index in useState to drive active/dim classes. In Vue, use v-for with :style for --w and a ref for the focused stage. In Angular, *ngFor with [style.--w] and a focused index. The grow keyframe and centring CSS port unchanged.