



Polar Area Chart — HTML CSS JS Rose Chart (No Lib)
Polar Area Chart · Charts · Plain HTML, CSS & JS · Live preview
Copy & paste
Source Code
<div class="pa-card">
  <div class="pa-head"><h3>Activity by day</h3></div>
  <div class="pa-body">
    <svg class="pa-svg" id="paSvg" viewBox="0 0 200 200" role="img" aria-label="Polar area chart"></svg>
    <ul class="pa-legend" id="paLegend"></ul>
  </div>
  <div class="pa-tip" id="paTip" hidden></div>
</div>*{box-sizing:border-box;margin:0;padding:0}
body{font-family:system-ui,-apple-system,sans-serif;background:#f1f5f9;min-height:100vh;display:flex;align-items:center;justify-content:center;padding:24px}
.pa-card{position:relative;background:#fff;border-radius:16px;padding:22px;width:100%;max-width:440px;box-shadow:0 18px 44px rgba(15,23,42,.08)}
.pa-head h3{font-size:16px;font-weight:800;color:#0f172a;margin-bottom:16px}
.pa-body{display:flex;align-items:center;gap:20px}
.pa-svg{width:180px;height:180px;flex-shrink:0;overflow:visible}
.pa-ring{fill:none;stroke:#eef2f7;stroke-width:1}
.pa-seg{cursor:pointer;transition:opacity .15s;opacity:.82}
.pa-seg:hover{opacity:1}
.pa-legend{list-style:none;display:flex;flex-direction:column;gap:7px;flex:1}
.pa-legend li{display:flex;align-items:center;gap:8px;font-size:12.5px;color:#475569}
.pa-dot{width:10px;height:10px;border-radius:3px;flex-shrink:0}
.pa-val{margin-left:auto;font-weight:800;color:#0f172a;font-variant-numeric:tabular-nums}
.pa-tip{position:absolute;pointer-events:none;background:#0f172a;color:#fff;font-size:12px;font-weight:700;padding:6px 10px;border-radius:8px;transform:translate(-50%,-130%);white-space:nowrap;z-index:5}
.pa-tip[hidden]{display:none}var DATA = [
{ name: 'Mon', value: 42, color: '#6366f1' },
{ name: 'Tue', value: 68, color: '#22c55e' },
{ name: 'Wed', value: 55, color: '#f59e0b' },
{ name: 'Thu', value: 81, color: '#ec4899' },
{ name: 'Fri', value: 90, color: '#0ea5e9' },
{ name: 'Sat', value: 34, color: '#14b8a6' },
{ name: 'Sun', value: 22, color: '#a855f7' },
];
var svg = document.getElementById('paSvg');
var legend = document.getElementById('paLegend');
var tip = document.getElementById('paTip');
var card = document.querySelector('.pa-card');
var SVGNS = 'http://www.w3.org/2000/svg';
var CX = 100, CY = 100, RMAX = 92;
function pt(frac, r) {
var a = frac * Math.PI * 2 - Math.PI / 2;
return [CX + r * Math.cos(a), CY + r * Math.sin(a)];
}
// Every slice spans an EQUAL angle; the VALUE controls each slice's radius.
function render() {
var max = Math.max.apply(null, DATA.map(function (d) { return d.value; }));
var n = DATA.length;
svg.innerHTML = '';
// Reference rings
[0.33, 0.66, 1].forEach(function (f) {
var c = document.createElementNS(SVGNS, 'circle');
c.setAttribute('class', 'pa-ring'); c.setAttribute('cx', CX); c.setAttribute('cy', CY); c.setAttribute('r', RMAX * f);
svg.appendChild(c);
});
DATA.forEach(function (d, i) {
var r = (d.value / max) * RMAX;
var start = i / n, end = (i + 1) / n;
var p0 = pt(start, r), p1 = pt(end, r);
var large = (end - start) > 0.5 ? 1 : 0;
var path = document.createElementNS(SVGNS, 'path');
path.setAttribute('class', 'pa-seg');
path.setAttribute('fill', d.color);
path.setAttribute('d', 'M' + CX + ',' + CY + ' L' + p0[0].toFixed(2) + ',' + p0[1].toFixed(2) +
' A' + r.toFixed(2) + ',' + r.toFixed(2) + ' 0 ' + large + ' 1 ' + p1[0].toFixed(2) + ',' + p1[1].toFixed(2) + ' Z');
path.dataset.name = d.name; path.dataset.value = d.value;
svg.appendChild(path);
});
legend.innerHTML = DATA.map(function (d) {
return '<li><span class="pa-dot" style="background:' + d.color + '"></span>' + d.name +
'<span class="pa-val">' + d.value + '</span></li>';
}).join('');
}
svg.addEventListener('mousemove', function (e) {
var seg = e.target.closest('.pa-seg');
if (!seg) { tip.hidden = true; return; }
var r = card.getBoundingClientRect();
tip.innerHTML = seg.dataset.name + ': <b>' + seg.dataset.value + '</b>';
tip.style.left = (e.clientX - r.left) + 'px';
tip.style.top = (e.clientY - r.top) + 'px';
tip.hidden = false;
});
svg.addEventListener('mouseleave', function () { tip.hidden = true; });
render();Extend with AI
Take This Snippet Further With AI
The AI prompt for this one is for Patreon supporters ($3 a month, 7 days free), along with a site with no ads. Supporters enter the passcode once and it is remembered in this browser.
What's included
Features
About this UI Snippet
Polar Area Chart — Equal-Angle Slices Whose Radius Encodes the Value
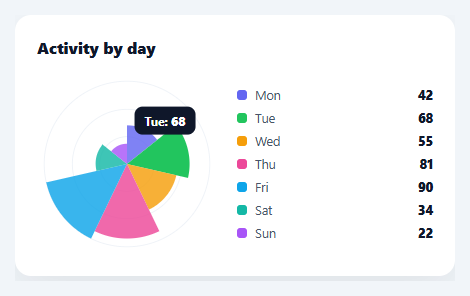
A polar area chart — also called a Nightingale rose or coxcomb chart, after Florence Nightingale who popularised it — is a circular chart where every slice takes an *equal* angle but extends to a *different* radius based on its value. It's a striking alternative to a bar chart for cyclical data like days of the week or months, where the circular form reinforces the cycle. This snippet builds it in plain HTML, CSS, SVG, and vanilla JavaScript, with reference rings, a legend, and hover tooltips — no charting library.
Equal angles, value-driven radii
This is the defining difference from a pie chart, and the snippet makes it explicit. In a pie, the *angle* of each slice encodes its value and the radius is constant. In a polar area chart, the *angle* is constant — every slice spans 1/n of the circle — and the *radius* encodes the value (value / max × maxRadius). So a busier day reaches further out while still occupying its fixed angular wedge. Each slice is drawn as an SVG arc-path wedge from the centre out to its value-scaled radius, using the same cos/sin arc math as a pie but with the radius varying per slice.
Reference rings for reading values
Because radius (not angle) carries the meaning, the eye needs concentric reference rings to judge how far each slice extends — the polar equivalent of a bar chart's gridlines. The snippet draws rings at a third, two-thirds, and full radius, so a viewer can estimate each slice's value by which ring it reaches. Without these rings a polar area chart is pretty but hard to read; with them it's quantitative.
Honest arc geometry
Each wedge moves to the centre, lines out to the start of its arc at the slice's radius, sweeps the arc to the end angle, and closes — with the large-arc-flag set correctly for any slice spanning more than half the circle (relevant if you chart few categories). Starting at twelve o'clock (the −90° offset) matches the convention people expect for circular charts.
Legend and tooltips
A legend lists every slice with its colour and value, and hovering a wedge shows its name and value at the cursor via getBoundingClientRect, with one delegated mousemove listener. Because each wedge is its own SVG path, every slice is independently hoverable and could be animated or highlighted.
Data-driven and drop-in
Feed it any array of { name, value, color } and it draws equal-angle, value-radius slices. It's especially suited to cyclical categories (days, months, hours, wind directions), and it's a clear reference for the polar-area construction and how it differs from a pie — the same arc math, applied to radius instead of angle.
Step by step
How to Use
- 1Paste HTML, CSS, and JSA polar area chart renders with seven equal-angle slices reaching different radii by value.
- 2Read with the ringsUse the concentric reference rings to judge how far each slice extends.
- 3Hover a sliceSee that slice's name and value in a tooltip.
- 4Swap in your dataReplace the DATA array with your own { name, value, color } items.
- 5Best for cyclical dataUse it for days, months, hours, or directions where the circular form reinforces the cycle.
- 6Wire to an APIFetch your figures, map them into the DATA shape, and call render().
Real-world uses
Common Use Cases
Got questions?
Frequently Asked Questions
In a pie chart, each slice's angle encodes its value and every slice shares the same radius. In a polar area (Nightingale rose) chart, it's reversed: every slice takes an equal angle (1/n of the circle) and the radius encodes the value, so larger values reach further out. This snippet computes equal angular wedges and scales each wedge's radius to its value.
Because radius carries the meaning, not angle, the viewer needs a scale to judge how far each slice extends — concentric rings are the polar equivalent of a bar chart's gridlines. Without them the chart looks decorative but is hard to read quantitatively; the rings at a third, two-thirds, and full radius let you estimate each slice's value at a glance.
It shines for cyclical categories — days of the week, months, hours of the day, compass directions — where arranging the data in a circle reinforces the natural cycle and lets you spot patterns (a weekend dip, a seasonal peak). For non-cyclical comparison, a bar chart is usually clearer; for part-to-whole, a pie. Use polar area when the cycle is part of the story.
Each wedge is an SVG path: move to the centre, line out to the slice's start angle at its value-scaled radius, sweep an arc to the end angle (same radius), and close. The angles are evenly divided across the circle and offset by −90° to start at twelve o'clock; the large-arc-flag is set for any slice over half the circle. It's the same arc math as a pie, applied with a per-slice radius.
In React, hold the data in useState and render paths/legend from .map() (or run render() in a useEffect with a ref); in Vue, use v-for or a template ref with onMounted; in Angular, *ngFor or ViewChild with ngAfterViewInit. The pt() arc math and radius scaling are framework-agnostic and port unchanged.