



Stacked Area Chart — SVG Multi-Series Area Graph
Stacked Area Chart · Charts · Plain HTML, CSS & JS · Live preview
Copy & paste
Source Code
<div class="sa-card">
  <div class="sa-head"><h3>Traffic by source</h3><span class="sa-total" id="saTotal"></span></div>
  <div class="sa-wrap">
    <svg class="sa-svg" id="saSvg" viewBox="0 0 320 180" preserveAspectRatio="none" aria-label="Stacked area chart"></svg>
    <div class="sa-tip" id="saTip" hidden></div>
  </div>
  <div class="sa-legend" id="saLegend"></div>
</div>*{box-sizing:border-box;margin:0;padding:0}
body{font-family:system-ui,-apple-system,sans-serif;background:#0f172a;color:#e2e8f0;display:flex;justify-content:center;padding:34px 18px}
.sa-card{background:#1e293b;border:1px solid #334155;border-radius:16px;padding:18px;width:100%;max-width:440px}
.sa-head{display:flex;align-items:baseline;justify-content:space-between;margin-bottom:12px}
.sa-head h3{font-size:15px;font-weight:800;color:#f1f5f9}
.sa-total{font-size:12px;color:#94a3b8;font-weight:600}
.sa-wrap{position:relative}
.sa-svg{width:100%;height:180px;display:block;overflow:visible}
.sa-area{opacity:.85;transition:opacity .15s}
.sa-grid{stroke:#334155;stroke-width:1}
.sa-guide{stroke:#64748b;stroke-width:1;stroke-dasharray:3 3;opacity:0}
.sa-dot{fill:#fff;opacity:0}
.sa-hit{fill:transparent;cursor:crosshair}
.sa-tip{position:absolute;transform:translate(-50%,-100%);background:#0b1120;border:1px solid #334155;border-radius:8px;padding:7px 10px;font-size:11px;pointer-events:none;white-space:nowrap;z-index:5;box-shadow:0 8px 20px rgba(0,0,0,.4)}
.sa-tip b{color:#f1f5f9}
.sa-tip i{display:inline-block;width:8px;height:8px;border-radius:2px;margin-right:5px;font-style:normal}
.sa-tip .sa-line{display:flex;align-items:center;gap:2px;color:#cbd5e1;margin-top:2px}
.sa-legend{display:flex;gap:14px;margin-top:12px;flex-wrap:wrap}
.sa-leg{display:flex;align-items:center;gap:6px;font-size:12px;color:#cbd5e1}
.sa-leg span{width:10px;height:10px;border-radius:3px}var SERIES = [
{ name: 'Direct', color: '#6366f1', data: [12,14,13,18,22,20,26,30] },
{ name: 'Search', color: '#22d3ee', data: [20,22,28,26,30,34,33,38] },
{ name: 'Social', color: '#f59e0b', data: [6,9,8,12,11,16,18,15] },
{ name: 'Referral',color: '#a855f7', data: [4,5,7,6,9,8,10,12] }
];
var LABELS = ['Mon','Tue','Wed','Thu','Fri','Sat','Sun','Mon'];
var W = 320, H = 180, PAD = 6, N = SERIES[0].data.length;
var svg = document.getElementById('saSvg');
var tip = document.getElementById('saTip');
var totals = [];
for (var i = 0; i < N; i++) { var s = 0; SERIES.forEach(function (sr) { s += sr.data[i]; }); totals.push(s); }
var maxTotal = Math.max.apply(null, totals);
function x(i) { return PAD + i / (N - 1) * (W - PAD * 2); }
function y(v) { return H - PAD - v / maxTotal * (H - PAD * 2); }
function build() {
var ns = 'http://www.w3.org/2000/svg';
svg.innerHTML = '';
// gridlines
for (var g = 0; g <= 3; g++) {
var gy = PAD + g / 3 * (H - PAD * 2);
var ln = document.createElementNS(ns, 'line');
ln.setAttribute('class', 'sa-grid'); ln.setAttribute('x1', 0); ln.setAttribute('x2', W); ln.setAttribute('y1', gy); ln.setAttribute('y2', gy);
svg.appendChild(ln);
}
// stacked areas, drawn top series last so they sit in front
var lower = new Array(N).fill(0);
SERIES.forEach(function (sr) {
var upper = lower.map(function (v, i) { return v + sr.data[i]; });
var d = 'M' + x(0) + ' ' + y(lower[0]);
for (var i = 0; i < N; i++) d += ' L' + x(i) + ' ' + y(upper[i]);
for (var j = N - 1; j >= 0; j--) d += ' L' + x(j) + ' ' + y(lower[j]);
d += ' Z';
var path = document.createElementNS(ns, 'path');
path.setAttribute('class', 'sa-area'); path.setAttribute('d', d); path.setAttribute('fill', sr.color);
svg.appendChild(path);
lower = upper;
});
// hover guide + invisible hit columns
var guide = document.createElementNS(ns, 'line');
guide.setAttribute('class', 'sa-guide'); guide.setAttribute('y1', PAD); guide.setAttribute('y2', H - PAD);
svg.appendChild(guide);
for (var k = 0; k < N; k++) {
(function (idx) {
var hit = document.createElementNS(ns, 'rect');
hit.setAttribute('class', 'sa-hit');
hit.setAttribute('x', idx === 0 ? 0 : (x(idx) + x(idx - 1)) / 2);
var right = idx === N - 1 ? W : (x(idx) + x(idx + 1)) / 2;
hit.setAttribute('width', right - (idx === 0 ? 0 : (x(idx) + x(idx - 1)) / 2));
hit.setAttribute('y', 0); hit.setAttribute('height', H);
hit.addEventListener('mouseenter', function () { showTip(idx, guide); });
hit.addEventListener('mouseleave', function () { tip.hidden = true; guide.style.opacity = 0; });
svg.appendChild(hit);
})(k);
}
}
function showTip(i, guide) {
guide.setAttribute('x1', x(i)); guide.setAttribute('x2', x(i)); guide.style.opacity = 1;
var rows = SERIES.map(function (sr) { return '<div class="sa-line"><i style="background:' + sr.color + '"></i>' + sr.name + ': <b>' + sr.data[i] + '</b></div>'; }).join('');
tip.innerHTML = '<b>' + LABELS[i] + '</b> · ' + totals[i] + ' total' + rows;
tip.hidden = false;
var rect = svg.getBoundingClientRect();
tip.style.left = (x(i) / W * rect.width) + 'px';
tip.style.top = (y(totals[i]) / H * rect.height - 8) + 'px';
}
document.getElementById('saTotal').textContent = totals.reduce(function (a, b) { return a + b; }, 0).toLocaleString() + ' visits';
document.getElementById('saLegend').innerHTML = SERIES.map(function (sr) { return '<span class="sa-leg"><span style="background:' + sr.color + '"></span>' + sr.name + '</span>'; }).join('');
build();
window.addEventListener('resize', function () { tip.hidden = true; });Extend with AI
Take This Snippet Further With AI
The AI prompt for this one is for Patreon supporters ($3 a month), along with a site with no ads. Supporters enter the passcode once and it is remembered in this browser.
What's included
Features
About this UI Snippet
Stacked Area Chart — Cumulative Multi-Series SVG Areas with Hover Tooltip
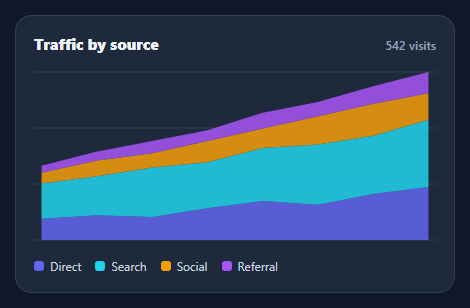
A stacked area chart shows how several series add up to a total over time, with each band sitting on top of the one below — ideal for traffic by source, revenue by product, or usage by tier. This snippet renders one from a data array in pure SVG, with gridlines, a hover guide, and a per-series tooltip, in plain HTML, CSS, and vanilla JavaScript with no charting library.
Stacking, done correctly
The core is the cumulative stack: for each series, the band's lower boundary is the running total of all series beneath it, and its upper boundary is that total plus the series' own values. The script walks the series keeping a lower array, computes upper, and builds a closed area path that traces the top edge left-to-right then the bottom edge back. Series are drawn in order so each sits cleanly on its predecessor, and the y-scale is based on the maximum stacked total so the tallest column just fits.
Scalable SVG with responsive width
The chart uses a fixed viewBox with preserveAspectRatio="none", so it stretches to its container's width while the math stays in tidy 0–320 coordinates. Horizontal gridlines give the eye reference levels. Everything is vector, so it's crisp at any size and weighs nothing.
Column hover with a shared guide
Hovering reveals a dashed vertical guide and a tooltip listing every series' value at that time point plus the stacked total — the read you actually want from a stacked chart ("what made up Friday?"). Rather than per-shape hit-testing, the chart lays invisible rectangle "columns" spanning the midpoints between points, so the nearest time index is selected reliably anywhere in that column, even over thin bands.
Tooltip positioning
The tooltip is an HTML element positioned over the SVG by converting chart coordinates to pixels using the SVG's rendered size, so it stays anchored to the hovered column at any width. Color chips in the tooltip tie each value back to its band.
Data-driven and portable
Series are an array of { name, color, data }, so adding a series or swapping the numbers needs no code changes — the stack, scale, legend, and tooltip all derive from the data. It's a compact, dependency-free reference for the stacked-area pattern that you'd otherwise pull in a chart library for.
Step by step
How to Use
- 1Paste HTML, CSS, and JSA four-series stacked area chart renders with a legend.
- 2Use your dataEdit the SERIES array of { name, color, data } and the LABELS.
- 3Hover the chartA guide and tooltip show each series and the total at that point.
- 4Read the stackBand heights show each source's contribution to the total.
- 5RestyleChange colors, gridline count, or chart height.
- 6ResizeIt stretches to its container via preserveAspectRatio.
Real-world uses
Common Use Cases
Got questions?
Frequently Asked Questions
The script keeps a running lower-boundary array, starting at zero. For each series it computes the upper boundary as lower plus that series' values, draws a closed area between the two boundaries, then sets lower to upper for the next series. This makes each band sit exactly on top of the ones below, and the y-scale uses the maximum stacked total so the tallest column fits.
Hit-testing the actual area shapes is unreliable — thin bands are hard to hover, and you want the same time index whether the cursor is over the top or bottom of the stack. Laying transparent rectangles that span the midpoints between points means hovering anywhere in a column selects that time index, which is how production charts handle tooltips.
The SVG uses a fixed viewBox (0 0 320 180) with preserveAspectRatio="none", so it scales to its container width while the drawing math stays in simple coordinates. The HTML tooltip is positioned by converting chart coordinates to pixels using the SVG's measured size, so it stays anchored to the right column at any width.
Edit the SERIES array — each entry is { name, color, data }, with data an array of values aligned to the LABELS. The stacking, scale, legend, and tooltip all derive from this array, so adding a series or changing numbers needs no other code. Keep every series' data the same length as the labels.
Compute the stacked paths from your series in a memo/computed and render them as SVG path elements. Track the hovered index in state for the guide and tooltip, driven by pointer handlers on the column rects. Libraries like Recharts or visx can replace the math, but the data shape stays the same. Tailwind users swap the classes for utilities.