



Waffle Chart — HTML CSS JS Square-Grid Percentage Chart
Waffle Chart · Charts · Plain HTML, CSS & JS · Live preview
Copy & paste
Source Code
<div class="wc-card">
  <div class="wc-head"><h3>Budget allocation</h3><span class="wc-sub">each square = 1%</span></div>
  <div class="wc-grid" id="wcGrid"></div>
  <ul class="wc-legend" id="wcLegend"></ul>
  <div class="wc-tip" id="wcTip" hidden></div>
</div>*{box-sizing:border-box;margin:0;padding:0}
body{font-family:system-ui,-apple-system,sans-serif;background:#f1f5f9;min-height:100vh;display:flex;align-items:center;justify-content:center;padding:24px}
.wc-card{position:relative;background:#fff;border-radius:16px;padding:22px;width:100%;max-width:380px;box-shadow:0 18px 44px rgba(15,23,42,.08)}
.wc-head{display:flex;align-items:baseline;justify-content:space-between;margin-bottom:14px}
.wc-head h3{font-size:16px;font-weight:800;color:#0f172a}
.wc-sub{font-size:11px;font-weight:600;color:#94a3b8}
.wc-grid{display:grid;grid-template-columns:repeat(10,1fr);gap:4px;margin-bottom:16px}
.wc-cell{aspect-ratio:1;border-radius:4px;background:#eef2f7;transition:transform .12s}
.wc-cell[data-c]{cursor:pointer}
.wc-cell[data-c]:hover{transform:scale(1.18)}
.wc-legend{list-style:none;display:flex;flex-direction:column;gap:8px}
.wc-legend li{display:flex;align-items:center;gap:9px;font-size:12.5px;color:#475569}
.wc-ldot{width:11px;height:11px;border-radius:3px;flex-shrink:0}
.wc-lname{font-weight:600}
.wc-lval{margin-left:auto;font-weight:800;color:#0f172a;font-variant-numeric:tabular-nums}
.wc-tip{position:absolute;pointer-events:none;background:#0f172a;color:#fff;font-size:12px;font-weight:700;padding:6px 10px;border-radius:8px;transform:translate(-50%,-130%);white-space:nowrap;z-index:5}
.wc-tip[hidden]{display:none}var DATA = [
{ name: 'Engineering', value: 38, color: '#6366f1' },
{ name: 'Marketing', value: 24, color: '#22c55e' },
{ name: 'Sales', value: 18, color: '#f59e0b' },
{ name: 'Operations', value: 12, color: '#ec4899' },
{ name: 'Other', value: 8, color: '#0ea5e9' },
];
var grid = document.getElementById('wcGrid');
var legend = document.getElementById('wcLegend');
var tip = document.getElementById('wcTip');
var card = document.querySelector('.wc-card');
var TOTAL = 100; // 10x10 grid of cells
// Largest-remainder rounding: round each share to whole cells, then distribute
// any leftover cells (from rounding) to the largest fractional parts so the grid
// always sums to exactly 100.
function allocate() {
var sum = DATA.reduce(function (s, d) { return s + d.value; }, 0);
var raw = DATA.map(function (d) { return d.value / sum * TOTAL; });
var floors = raw.map(Math.floor);
var used = floors.reduce(function (s, n) { return s + n; }, 0);
var remainder = TOTAL - used;
var order = raw.map(function (v, i) { return { i: i, frac: v - floors[i] }; })
.sort(function (a, b) { return b.frac - a.frac; });
for (var k = 0; k < remainder; k++) floors[order[k].i]++;
return floors;
}
function render() {
var counts = allocate();
var cells = [];
DATA.forEach(function (d, di) {
for (var n = 0; n < counts[di]; n++) {
cells.push('<div class="wc-cell" data-c="' + di + '" style="background:' + d.color + '"></div>');
}
});
// Fill any remainder (shouldn't occur) with empty cells.
while (cells.length < TOTAL) cells.push('<div class="wc-cell"></div>');
grid.innerHTML = cells.join('');
legend.innerHTML = DATA.map(function (d, di) {
return '<li><span class="wc-ldot" style="background:' + d.color + '"></span>' +
'<span class="wc-lname">' + d.name + '</span><span class="wc-lval">' + counts[di] + '%</span></li>';
}).join('');
}
grid.addEventListener('mousemove', function (e) {
var cell = e.target.closest('.wc-cell[data-c]');
if (!cell) { tip.hidden = true; return; }
var d = DATA[+cell.dataset.c];
var r = card.getBoundingClientRect();
tip.textContent = d.name;
tip.style.left = (e.clientX - r.left) + 'px';
tip.style.top = (e.clientY - r.top) + 'px';
tip.hidden = false;
});
grid.addEventListener('mouseleave', function () { tip.hidden = true; });
render();Extend with AI
Take This Snippet Further With AI
The AI prompt for this one is for Patreon supporters ($3 a month), along with a site with no ads. Supporters enter the passcode once and it is remembered in this browser.
What's included
Features
About this UI Snippet
Waffle Chart — A 100-Square Grid Where Each Cell Is One Percent
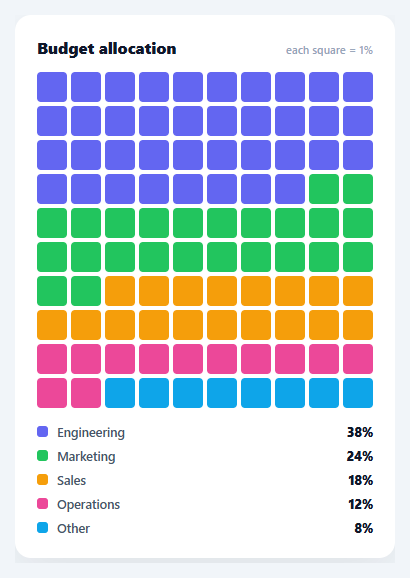
A waffle chart shows part-to-whole composition as a 10×10 grid of 100 squares, each representing one percent, coloured by category. It is often easier to read than a pie chart because counting squares is more intuitive than judging angles. This snippet builds it in plain HTML, CSS, and vanilla JavaScript, with correct rounding so the categories always fill exactly 100 cells — no charting library.
The grid is the chart
A CSS grid of 100 square cells (10 columns, aspect-ratio: 1) is the entire canvas. Each category claims a run of cells in its colour, filled in order, so the coloured blocks read as proportions of the whole. Using a real grid of elements (rather than a drawn chart) means every cell is a DOM node you can hover, and the layout is naturally responsive — the squares scale with the card width.
Largest-remainder rounding (the hard part)
The subtle problem every waffle chart faces: percentages rarely round to whole cells that sum to 100. If you naively round each category, you might end up with 99 or 101 cells. The snippet uses the largest-remainder method: floor each category's cell count, then hand out the leftover cells one at a time to the categories with the biggest fractional remainders. This guarantees the grid sums to exactly 100 while distributing rounding as fairly as possible — the same apportionment method used for allocating seats from vote shares. Getting this right is what keeps the waffle honest and gap-free.
Color runs and an empty fallback
Cells are generated category by category, so each colour forms a contiguous run across the grid (left-to-right, top-to-bottom). Any unallocated cells (which should not occur once rounding sums to 100) fall back to a neutral empty colour, so the grid never breaks. Hovering a coloured cell shows its category name in a tooltip.
A legend with the rounded values
The legend lists each category with its colour and its *rounded* cell count (the number actually shown), not the raw percentage — so the legend always agrees with what is on the grid. Showing the displayed value rather than the source number avoids the confusing case where the legend says 38% but you can count 37 squares.
Data-driven and drop-in
It renders from a DATA array of { name, value, color }; values need not pre-sum to 100 (they are normalised). Swap in budget splits, market share, time allocation, or survey results and it lays out the grid. It is a clear, dependency-free reference for waffle layout and the largest-remainder rounding that part-to-whole square charts require. The same largest-remainder method generalises beyond charts — it's the standard algorithm for apportioning parliamentary seats by vote share, splitting a fixed pool of anything (budget headcount, inventory units) across categories by percentage, and any other case where rounded shares of a whole must still sum to the whole exactly. It's worth implementing once as a small, generic allocate(values, total) helper rather than re-deriving it per chart, since the floor-then-distribute-remainders logic here doesn't reference anything specific to waffle rendering — the exact same function would apportion budget headcount across departments or seats across parties from vote percentages.
Step by step
How to Use
- 1Paste HTML, CSS, and JSA 10x10 waffle chart renders, each square representing 1% of the whole.
- 2Read the blocksEach colour's run of squares is its share; the legend lists the percentages.
- 3Hover a squareSee which category a cell belongs to in a tooltip.
- 4Swap in your dataReplace the DATA array with your own { name, value, color } items.
- 5Values need not total 100They are normalised, and rounding ensures the grid always fills exactly 100 cells.
- 6Resize the gridChange the grid-template-columns count (and TOTAL) for a different cell count.
Real-world uses
Common Use Cases
Got questions?
Frequently Asked Questions
Each category's share rarely converts to a whole number of cells, and naively rounding each one can make the total come out to 99 or 101 instead of 100. The largest-remainder method floors every count, then distributes the leftover cells one at a time to the categories with the largest fractional parts. This guarantees the grid sums to exactly 100 while keeping the rounding as fair as possible.
No. The values are normalised — each category's cell count is value ÷ total × 100 — so you can pass raw amounts (dollars, counts, hours) and the chart converts them to percentages of their sum. The largest-remainder rounding then ensures those convert to whole cells that fill the grid exactly.
Because rounding can make the displayed squares differ slightly from the source percentage (38.4% becomes 38 cells). Showing the rounded cell count in the legend means the legend always matches what you can count on the grid, avoiding the confusing case where the legend and the visible squares disagree.
Yes. Change grid-template-columns to a different column count and set TOTAL to the number of cells (e.g. 5x5 = 25, or 10x20 = 200 for half-percent resolution). The allocation scales to whatever TOTAL you choose, so each cell represents 100/TOTAL percent. Keep TOTAL and the column count consistent for square cells.
In React, hold the data in useState, compute the cell allocation with useMemo, and render the grid from it; in Vue, use a computed counts array with v-for; in Angular, a getter with *ngFor. The allocate() largest-remainder logic is framework-agnostic — only the state and rendering move into the framework.