



Sunburst Chart — Hierarchical Ring Chart in SVG
Sunburst Chart · Charts · Plain HTML, CSS & JS · Live preview
Copy & paste
Source Code
<div class="sb-card">
  <h3>Storage by category</h3>
  <div class="sb-wrap">
    <svg class="sb-svg" id="sbSvg" viewBox="0 0 220 220" aria-label="Sunburst chart"></svg>
    <div class="sb-center" id="sbCenter"><strong id="sbVal">100%</strong><span id="sbCap">Total</span></div>
  </div>
  <div class="sb-legend" id="sbLegend"></div>
</div>*{box-sizing:border-box;margin:0;padding:0}
body{font-family:system-ui,-apple-system,sans-serif;background:#0f172a;color:#e2e8f0;display:flex;justify-content:center;padding:30px 18px}
.sb-card{background:#1e293b;border:1px solid #334155;border-radius:16px;padding:20px;width:100%;max-width:340px;text-align:center}
.sb-card h3{font-size:15px;font-weight:800;color:#f1f5f9;margin-bottom:12px}
.sb-wrap{position:relative;width:220px;height:220px;margin:0 auto}
.sb-svg{width:220px;height:220px}
.sb-seg{cursor:pointer;transition:opacity .12s,transform .12s;transform-origin:110px 110px}
.sb-seg:hover{opacity:.85}
.sb-seg.is-dim{opacity:.25}
.sb-center{position:absolute;inset:0;display:flex;flex-direction:column;align-items:center;justify-content:center;pointer-events:none}
.sb-center strong{font-size:26px;font-weight:800;color:#f1f5f9;font-variant-numeric:tabular-nums}
.sb-center span{font-size:11px;font-weight:600;color:#94a3b8;text-transform:uppercase;letter-spacing:.05em;max-width:120px}
.sb-legend{display:flex;flex-wrap:wrap;gap:8px 14px;justify-content:center;margin-top:14px}
.sb-leg{display:flex;align-items:center;gap:6px;font-size:12px;color:#cbd5e1}
.sb-leg span{width:10px;height:10px;border-radius:3px}var DATA = [
{ name:'Media', color:'#6366f1', children:[ {name:'Photos',value:38}, {name:'Video',value:22}, {name:'Audio',value:8} ] },
{ name:'Docs', color:'#22d3ee', children:[ {name:'PDFs',value:14}, {name:'Sheets',value:9} ] },
{ name:'Apps', color:'#f59e0b', children:[ {name:'System',value:11}, {name:'Games',value:6} ] },
{ name:'Other', color:'#a855f7', children:[ {name:'Cache',value:7}, {name:'Misc',value:5} ] }
];
var ns = 'http://www.w3.org/2000/svg';
var CX = 110, CY = 110, R0 = 34, R1 = 70, R2 = 104;
var svg = document.getElementById('sbSvg');
var valEl = document.getElementById('sbVal'), capEl = document.getElementById('sbCap');
function shade(hex, amt) {
var n = parseInt(hex.slice(1), 16);
var r = Math.min(255, ((n >> 16) & 255) + amt), g = Math.min(255, ((n >> 8) & 255) + amt), b = Math.min(255, (n & 255) + amt);
return 'rgb(' + r + ',' + g + ',' + b + ')';
}
function polar(r, a) { return [CX + r * Math.cos(a - Math.PI / 2), CY + r * Math.sin(a - Math.PI / 2)]; }
function sector(rIn, rOut, a0, a1) {
var p0 = polar(rOut, a0), p1 = polar(rOut, a1), p2 = polar(rIn, a1), p3 = polar(rIn, a0);
var large = (a1 - a0) > Math.PI ? 1 : 0;
return 'M' + p0[0] + ' ' + p0[1] + ' A' + rOut + ' ' + rOut + ' 0 ' + large + ' 1 ' + p1[0] + ' ' + p1[1] +
' L' + p2[0] + ' ' + p2[1] + ' A' + rIn + ' ' + rIn + ' 0 ' + large + ' 0 ' + p3[0] + ' ' + p3[1] + ' Z';
}
var total = 0;
DATA.forEach(function (p) { p.value = p.children.reduce(function (s, c) { return s + c.value; }, 0); total += p.value; });
var segs = [];
function addSeg(d, color, label, value) {
var path = document.createElementNS(ns, 'path');
path.setAttribute('class', 'sb-seg'); path.setAttribute('d', d); path.setAttribute('fill', color);
path.setAttribute('stroke', '#1e293b'); path.setAttribute('stroke-width', '1.5');
path.addEventListener('mouseenter', function () { focus(label, value); });
svg.appendChild(path);
segs.push(path);
return path;
}
function focus(label, value) {
valEl.textContent = Math.round(value / total * 100) + '%';
capEl.textContent = label;
}
function reset() { valEl.textContent = '100%'; capEl.textContent = 'Total'; segs.forEach(function (s) { s.classList.remove('is-dim'); }); }
var angle = 0;
DATA.forEach(function (p) {
var span = p.value / total * Math.PI * 2;
var a0 = angle, a1 = angle + span;
addSeg(sector(R0, R1, a0, a1), p.color, p.name, p.value);
// outer ring: children within the parent's span
var ca = a0;
p.children.forEach(function (c, ci) {
var cspan = c.value / total * Math.PI * 2;
addSeg(sector(R1, R2, ca, ca + cspan), shade(p.color, 24 + ci * 14), p.name + ' › ' + c.name, c.value);
ca += cspan;
});
angle = a1;
});
svg.addEventListener('mouseleave', reset);
document.getElementById('sbLegend').innerHTML = DATA.map(function (p) { return '<span class="sb-leg"><span style="background:' + p.color + '"></span>' + p.name + '</span>'; }).join('');Extend with AI
Take This Snippet Further With AI
The AI prompt for this one is for Patreon supporters ($3 a month, 7 days free), along with a site with no ads. Supporters enter the passcode once and it is remembered in this browser.
What's included
Features
About this UI Snippet
Sunburst Chart — Nested Ring Hierarchy with Hover Focus
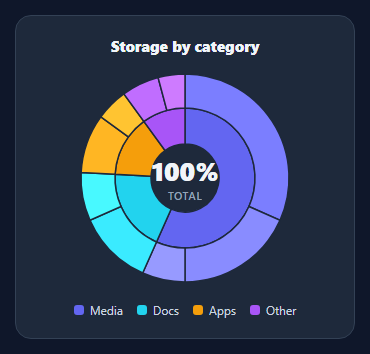
A sunburst chart shows a hierarchy as concentric rings — the inner ring is the top-level categories and each outer arc is a child nested within its parent's angular slice. It's the compact way to show part-of-whole relationships at two levels, like storage by category and file type. This snippet renders one in pure SVG with hover focus and a centre readout, in plain HTML, CSS, and vanilla JavaScript with no charting library.
Annular sector path math
Each segment is an annular sector (a slice of a ring) drawn with one SVG path: two arcs (outer and inner radius) joined by straight edges. A polar(r, a) helper converts a radius and angle to x/y around the centre (offset by −90° so angles start at the top), and a sector() function assembles the path with the correct large-arc-flag for slices over 180°. This is the same arc-drawing technique behind donut and pie charts, extended to nested rings.
Hierarchy and proportional angles
Data is a list of parents, each with children. The script sums each parent's children to get its value and the grand total, then assigns every node an angular span proportional to its value out of the total. Critically, children are laid out within their parent's span, so the outer ring nests correctly — a child's arc sits directly outside the parent slice it belongs to. Child colours are tints of the parent colour, so the family relationship reads visually.
Hover focus and the centre readout
Hovering any segment shows its label and its percentage of the total in the centre — for an outer arc it shows the full path ("Media › Photos"), so you always know where you are in the hierarchy. Leaving the chart resets the centre to the total. The centre is an overlaid HTML element, so the text is crisp and easy to style independently of the SVG.
Lightweight and legible
Thin strokes separate the segments, hover dims slightly for feedback, and a legend ties the inner-ring colours to their categories. Everything derives from the data array, so changing the hierarchy or values needs no code edits.
Dependency-free reference
The whole chart is the sector math plus a layout loop — no D3 or chart library — making it a clean, portable reference for the sunburst pattern when you need hierarchical proportions without the weight of a full visualization toolkit.
Step by step
How to Use
- 1Paste HTML, CSS, and JSA two-level sunburst renders with a legend and center total.
- 2Use your dataEdit DATA — parents with children and values; parents auto-sum.
- 3Hover a segmentThe center shows its label and percentage of the total.
- 4Read the ringsInner ring is categories; outer arcs are nested children.
- 5RestyleChange colors, radii, or stroke; child tints derive from parents.
- 6ResizeAdjust the viewBox and container to scale the chart.
Real-world uses
Common Use Cases
Got questions?
Frequently Asked Questions
Every segment is an annular sector — a slice of a ring — built as one SVG path: an outer arc, a line in to the inner radius, an inner arc back, and a closing line. A polar helper converts a radius and angle to coordinates around the centre (offset so angles begin at the top), and the path uses the large-arc-flag to handle slices over 180 degrees. It is the donut-arc technique applied to two radii.
Each parent gets an angular span proportional to its total. Children are then laid out sequentially within that exact span, each taking an angle proportional to its own value out of the grand total. Because the child arcs start where the parent slice starts and fill its span, the outer ring lines up directly outside the matching inner slice, which is what makes it read as a hierarchy.
Coloring children as lighter shades of their parent's color makes the family relationship obvious without a busy legend — you can see at a glance which outer arcs belong to which inner category. The snippet derives child shades by lightening the parent color by an increasing amount per child, so siblings are distinguishable but clearly related.
Yes. The sector function works for any inner/outer radius pair, so you can add a third ring by extending the layout loop to recurse into grandchildren within each child's span. For drill-down, animate radii and re-layout on click to zoom into a branch. The math stays the same; you are just adding rings and transitions.
Compute the segment list (label, path, color, value) from your data in a memo/computed and render them as SVG paths. Track the hovered node in state to drive the center readout. D3's partition/arc or a chart library can replace the math for complex cases, but the data shape and rendering approach are the same. Tailwind users swap the classes for utilities.