



Pie Chart — HTML CSS JS SVG Pie Chart (No Library)
Pie Chart · Charts · Plain HTML, CSS & JS · Live preview
Copy & paste
Source Code
<div class="pc-card">
  <div class="pc-head">
    <h3>Traffic by source</h3>
    <span class="pc-total" id="pcTotal"></span>
  </div>
  <div class="pc-body">
    <svg class="pc-svg" id="pcSvg" viewBox="0 0 200 200" role="img" aria-label="Pie chart of traffic by source"></svg>
    <ul class="pc-legend" id="pcLegend"></ul>
  </div>
  <div class="pc-tip" id="pcTip" hidden></div>
</div>*{box-sizing:border-box;margin:0;padding:0}
body{font-family:system-ui,-apple-system,sans-serif;background:#f1f5f9;min-height:100vh;display:flex;align-items:center;justify-content:center;padding:24px}
.pc-card{position:relative;background:#fff;border-radius:16px;padding:22px;width:100%;max-width:420px;box-shadow:0 18px 44px rgba(15,23,42,.08)}
.pc-head{display:flex;align-items:baseline;justify-content:space-between;margin-bottom:16px}
.pc-head h3{font-size:16px;font-weight:800;color:#0f172a}
.pc-total{font-size:12.5px;font-weight:700;color:#94a3b8}
.pc-body{display:flex;align-items:center;gap:20px}
.pc-svg{width:160px;height:160px;flex-shrink:0;overflow:visible}
.pc-slice{cursor:pointer;transition:opacity .15s;transform-origin:100px 100px}
.pc-slice:hover{opacity:.85}
.pc-legend{list-style:none;display:flex;flex-direction:column;gap:9px;flex:1}
.pc-legend li{display:flex;align-items:center;gap:9px;font-size:12.5px;color:#475569;cursor:pointer}
.pc-legend li.mute{opacity:.4}
.pc-dot{width:11px;height:11px;border-radius:3px;flex-shrink:0}
.pc-name{font-weight:600}
.pc-val{margin-left:auto;font-weight:800;color:#0f172a;font-variant-numeric:tabular-nums}
.pc-tip{position:absolute;pointer-events:none;background:#0f172a;color:#fff;font-size:12px;font-weight:600;padding:6px 10px;border-radius:8px;transform:translate(-50%,-130%);white-space:nowrap;z-index:5}
.pc-tip[hidden]{display:none}
.pc-tip b{font-weight:800}var DATA = [
{ name: 'Organic search', value: 4820, color: '#6366f1' },
{ name: 'Direct', value: 2410, color: '#22c55e' },
{ name: 'Social', value: 1560, color: '#f59e0b' },
{ name: 'Referral', value: 980, color: '#ec4899' },
{ name: 'Email', value: 540, color: '#0ea5e9' },
];
var svg = document.getElementById('pcSvg');
var legend = document.getElementById('pcLegend');
var tip = document.getElementById('pcTip');
var card = document.querySelector('.pc-card');
var SVGNS = 'http://www.w3.org/2000/svg';
var CX = 100, CY = 100, R = 92;
var hidden = {};
function total() {
return DATA.reduce(function (s, d) { return hidden[d.name] ? s : s + d.value; }, 0);
}
// Point on the circle for a given fraction (0..1), starting at 12 o'clock.
function point(frac) {
var a = frac * Math.PI * 2 - Math.PI / 2;
return [CX + R * Math.cos(a), CY + R * Math.sin(a)];
}
function slicePath(start, end) {
var p0 = point(start), p1 = point(end);
var large = end - start > 0.5 ? 1 : 0;
// Move to centre, line to arc start, arc to end, close — a filled wedge.
return 'M' + CX + ',' + CY + ' L' + p0[0].toFixed(2) + ',' + p0[1].toFixed(2) +
' A' + R + ',' + R + ' 0 ' + large + ' 1 ' + p1[0].toFixed(2) + ',' + p1[1].toFixed(2) + ' Z';
}
function render() {
var sum = total();
document.getElementById('pcTotal').textContent = sum.toLocaleString() + ' visits';
svg.innerHTML = '';
var acc = 0;
DATA.forEach(function (d) {
if (hidden[d.name]) return;
var frac = d.value / sum;
var start = acc, end = acc + frac;
acc = end;
var path = document.createElementNS(SVGNS, 'path');
path.setAttribute('class', 'pc-slice');
path.setAttribute('fill', d.color);
path.setAttribute('d', slicePath(start, end));
path.dataset.name = d.name;
path.dataset.value = d.value;
path.dataset.pct = (frac * 100).toFixed(1);
svg.appendChild(path);
});
// Legend (always lists every series so muted ones can be toggled back on).
legend.innerHTML = DATA.map(function (d) {
return '<li data-name="' + d.name + '" class="' + (hidden[d.name] ? 'mute' : '') + '">' +
'<span class="pc-dot" style="background:' + d.color + '"></span>' +
'<span class="pc-name">' + d.name + '</span>' +
'<span class="pc-val">' + d.value.toLocaleString() + '</span></li>';
}).join('');
}
svg.addEventListener('mousemove', function (e) {
var slice = e.target.closest('.pc-slice');
if (!slice) { tip.hidden = true; return; }
var r = card.getBoundingClientRect();
tip.innerHTML = slice.dataset.name + ': <b>' + Number(slice.dataset.value).toLocaleString() + '</b> (' + slice.dataset.pct + '%)';
tip.style.left = (e.clientX - r.left) + 'px';
tip.style.top = (e.clientY - r.top) + 'px';
tip.hidden = false;
});
svg.addEventListener('mouseleave', function () { tip.hidden = true; });
legend.addEventListener('click', function (e) {
var li = e.target.closest('li');
if (!li) return;
var name = li.dataset.name;
// Don't allow hiding the last visible slice.
var visible = DATA.filter(function (d) { return !hidden[d.name]; }).length;
if (!hidden[name] && visible <= 1) return;
hidden[name] = !hidden[name];
render();
});
render();Extend with AI
Take This Snippet Further With AI
The AI prompt for this one is for Patreon supporters ($3 a month, 7 days free), along with a site with no ads. Supporters enter the passcode once and it is remembered in this browser.
What's included
Features
About this UI Snippet
Pie Chart — SVG Arc-Path Pie Chart with Hover Tooltips & Toggleable Legend
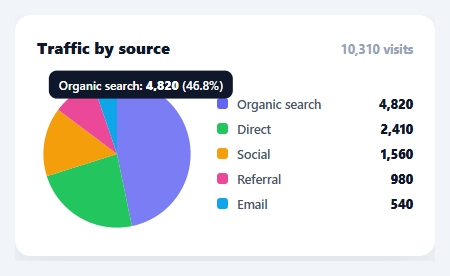
A pie chart shows part-to-whole composition at a glance — what share each source, category, or segment contributes to a total. This snippet builds a complete, interactive pie chart in plain HTML, CSS, SVG, and vanilla JavaScript, with no charting library: each slice is a real SVG <path> wedge computed from the data, with hover tooltips, a legend that toggles slices on and off, and percentages that recalculate live.
Real SVG wedges, computed with trigonometry
Each slice is an SVG path made of three commands: move to the centre, line out to the start of the arc, then an elliptical A (arc) command sweeping to the end of the slice, then close. The start and end points are found with point(frac), which converts a fraction of the circle (0–1) into x/y coordinates using Math.cos/Math.sin, offset by −90° so the chart starts at twelve o'clock like every pie chart people expect. The arc's large-arc-flag is set to 1 whenever a slice spans more than half the circle, which is the one detail that trips people up when drawing arcs by hand — get it wrong and big slices render inverted.
Why SVG paths instead of conic-gradient
You can fake a pie with a single conic-gradient, but that gives you one flat element with no per-slice interactivity — no hover target, no individual slice to highlight or pull out, no accessible structure. Drawing each slice as its own path means every slice is a real DOM node you can attach a tooltip to, fade on hover, animate independently, or click. That interactivity is the whole point of a chart, so the small amount of arc math is worth it.
A legend that toggles slices
The legend lists every series with its colour swatch and value. Clicking a legend row hides or shows that slice, and the chart re-renders with the remaining slices re-proportioned to the new total — the same behaviour as Chart.js and every dashboard charting tool. A guard prevents hiding the last visible slice (an empty pie is meaningless), and hidden rows stay in the legend, dimmed, so they can be toggled back on. Because the percentages derive from the live total, hiding a slice recalculates everyone else's share automatically.
Tooltips positioned to the cursor
Hovering a slice shows a tooltip with the series name, its raw value, and its percentage, positioned at the mouse using getBoundingClientRect to convert the page coordinates into offsets within the card. The tooltip is pointer-events: none so it never flickers by intercepting its own hover, and it follows the cursor smoothly via a single mousemove listener on the SVG with event delegation through closest('.pc-slice').
Data-driven and drop-in
The entire chart renders from a DATA array of { name, value, color } — swap in your analytics, budget, or survey numbers and everything (slices, legend, total, percentages) updates. Because it's compact and dependency-free, it drops into any dashboard or report, and the arc math is a clear reference for understanding how SVG pie and donut charts are actually drawn.
Step by step
How to Use
- 1Paste HTML, CSS, and JSA pie chart renders with five slices, a legend, and a running total of visits.
- 2Hover a sliceMove over any wedge to see a tooltip with its name, value, and percentage of the total.
- 3Toggle slicesClick a legend row to hide that slice; the remaining slices re-proportion and the total updates.
- 4Swap in your dataReplace the DATA array with your own { name, value, color } items — slices, legend, and percentages all derive from it.
- 5Restyle itChange the colours, radius (R), or card styling; the arc math adapts to any radius automatically.
- 6Wire to an APIFetch your figures, map them to the DATA shape, and call render() to draw the live chart.
Real-world uses
Common Use Cases
Got questions?
Frequently Asked Questions
Each slice is an SVG <path> built from three commands: move to the centre, line to the slice's start point on the circle, then an elliptical arc (A) to its end point, then close (Z). The start/end points come from point(frac), which converts a fraction of the circle into x/y with Math.cos/Math.sin offset by −90° so the chart begins at twelve o'clock. The arc's large-arc-flag is set to 1 for any slice spanning more than half the circle.
A conic-gradient renders a pie as a single flat element with no per-slice interactivity — you can't hover, highlight, pull out, or animate an individual slice. Drawing each slice as its own <path> makes every slice a real DOM node you can attach tooltips and click handlers to, which is the entire value of an interactive chart. The arc math is the small cost of that interactivity.
Clicking a legend row flips a flag in the hidden map and calls render(), which recomputes the total from only the visible slices and redraws each remaining wedge proportioned to that new total. Because percentages and the running total both derive from the live sum, hiding one slice automatically re-proportions the rest — the same behaviour as professional charting libraries.
Edit the DATA array — each entry is { name, value, color }. Add, remove, or change entries and the slices, legend, total, and percentages all derive from it on the next render(). For real data, fetch your numbers, map them into that shape, and call render(); the arc math handles any number of slices and any values.
In React, hold the data and hidden state in useState and render the slices/legend from .map() with onClick toggles; in Vue, use v-for with ref state; in Angular, use *ngFor with component properties. The point()/slicePath() arc math is framework-agnostic — only the state and event wiring move into the framework, and the SVG paths render identically.