

Cohort Retention Heatmap — Free Weekly Retention Grid Snippet
Cohort Retention Heatmap · Charts · Plain HTML, CSS & JS · Live preview
Copy & paste
Source Code
<div class="crh-card">
  <div class="crh-head">
    <div>
      <h2>Cohort Retention</h2>
      <p class="crh-sub">Percent of each signup cohort still active, by week since signup</p>
    </div>
    <div class="crh-legend" id="crhLegend" aria-hidden="true"></div>
  </div>
  <div class="crh-scroll">
    <table class="crh-table" id="crhTable" aria-label="Cohort retention heatmap"></table>
  </div>
  <div class="crh-tooltip" id="crhTooltip" role="status"></div>
</div>*{box-sizing:border-box}
body{font-family:system-ui,-apple-system,sans-serif;background:#0e1016;min-height:100vh;display:flex;align-items:center;justify-content:center;padding:24px}
.crh-card{font-family:system-ui,-apple-system,sans-serif;background:#0e1016;color:#e7e9f2;border:1px solid #23273a;border-radius:16px;padding:22px;max-width:760px;margin:0 auto;position:relative}
.crh-head{display:flex;justify-content:space-between;align-items:flex-start;gap:16px;flex-wrap:wrap;margin-bottom:16px}
.crh-head h2{font-size:18px;margin:0 0 4px}
.crh-sub{font-size:13px;color:#8b90a8;margin:0;max-width:340px}
.crh-legend{display:flex;align-items:center;gap:4px}
.crh-legend-cell{width:16px;height:16px;border-radius:3px}
.crh-legend-labels{display:flex;justify-content:space-between;font-size:10px;color:#8b90a8;width:100%}
.crh-scroll{overflow-x:auto}
.crh-table{border-collapse:separate;border-spacing:4px;font-size:12px}
.crh-table th{font-weight:600;color:#8b90a8;padding:4px 6px;text-align:center;font-size:11px}
.crh-table td.crh-row-label{color:#c7cae0;font-weight:600;text-align:left;padding:0 10px 0 0;white-space:nowrap;font-size:12px}
.crh-cell{width:44px;height:30px;border-radius:6px;text-align:center;font-size:11px;font-weight:600;cursor:default;transition:transform .12s ease,outline-color .12s ease;outline:2px solid transparent;outline-offset:-2px}
.crh-cell:hover{transform:scale(1.08);outline-color:rgba(255,255,255,.5);z-index:2;position:relative}
.crh-cell.crh-empty{background:transparent;cursor:default}
.crh-cell.crh-empty:hover{transform:none}
.crh-tooltip{position:absolute;pointer-events:none;background:#1b1f30;border:1px solid #2e3450;padding:6px 10px;border-radius:8px;font-size:12px;color:#fff;opacity:0;transform:translate(-50%,-8px);transition:opacity .1s ease;white-space:nowrap;z-index:10}
.crh-tooltip.crh-show{opacity:1}// Real percentage-to-color mapping: given a 0-100 retention value, compute
// an actual RGBA color (not a lookup table of hardcoded per-cell colors).
function retentionColor(pct) {
// Clamp and normalize to 0..1
var t = Math.max(0, Math.min(100, pct)) / 100;
// Base hue (teal/cyan) with intensity driven by t: low retention is dim,
// high retention is bright and saturated. Alpha scales with t as well so
// the empty/near-zero cells read as nearly transparent.
var hue = 178; // teal
var sat = 55 + t * 30; // 55% -> 85%
var light = 14 + t * 34; // 14% -> 48%
var alpha = 0.18 + t * 0.82; // 0.18 -> 1.0
return 'hsla(' + hue + ',' + sat.toFixed(0) + '%,' + light.toFixed(0) + '%,' + alpha.toFixed(2) + ')';
}
function textColor(pct) {
return pct >= 45 ? '#062024' : '#cfe9ec';
}
// Simulated cohort dataset: each cohort has a starting size and a retention
// curve. Values are generated with a simple decay model plus mild jitter so
// the grid looks organic; every cell's color is still derived only through
// retentionColor().
var weeks = 8;
var cohorts = [
{ label: 'Jun 29', base: 100 },
{ label: 'Jul 06', base: 100 },
{ label: 'Jul 13', base: 100 },
{ label: 'Jul 20', base: 100 },
{ label: 'Jul 27', base: 100 },
{ label: 'Aug 03', base: 100 },
{ label: 'Aug 10', base: 100 },
{ label: 'Aug 17', base: 100 },
];
function seedRand(seed) {
var s = seed;
return function () {
s = (s * 9301 + 49297) % 233280;
return s / 233280;
};
}
var data = cohorts.map(function (c, ci) {
var rand = seedRand(ci * 97 + 13);
var row = [];
var decay = 0.72 + rand() * 0.1; // per-week retention decay factor
var val = 100;
for (var w = 0; w < weeks; w++) {
if (w === 0) {
row.push(100);
} else if (w > weeks - 1 - ci) {
row.push(null); // not enough elapsed time yet for this cohort
} else {
val = val * decay + (rand() - 0.5) * 4;
val = Math.max(4, Math.min(val, row[w - 1]));
row.push(Math.round(val));
}
}
return { label: c.label, values: row };
});
var table = document.getElementById('crhTable');
var tooltip = document.getElementById('crhTooltip');
var card = document.querySelector('.crh-card');
var thead = document.createElement('tr');
thead.appendChild(document.createElement('th'));
for (var w = 0; w < weeks; w++) {
var th = document.createElement('th');
th.textContent = 'W' + w;
thead.appendChild(th);
}
table.appendChild(thead);
data.forEach(function (row) {
var tr = document.createElement('tr');
var labelCell = document.createElement('td');
labelCell.className = 'crh-row-label';
labelCell.textContent = row.label;
tr.appendChild(labelCell);
row.values.forEach(function (pct) {
var td = document.createElement('td');
if (pct === null) {
td.className = 'crh-cell crh-empty';
} else {
var div = document.createElement('div');
td.className = 'crh-cell';
td.style.background = retentionColor(pct);
td.style.color = textColor(pct);
td.textContent = pct + '%';
td.addEventListener('mouseenter', function (e) {
var rect = td.getBoundingClientRect();
var cardRect = card.getBoundingClientRect();
tooltip.textContent = row.label + ' cohort — ' + pct + '% retained';
tooltip.style.left = (rect.left - cardRect.left + rect.width / 2) + 'px';
tooltip.style.top = (rect.top - cardRect.top - 8) + 'px';
tooltip.classList.add('crh-show');
});
td.addEventListener('mouseleave', function () {
tooltip.classList.remove('crh-show');
});
}
tr.appendChild(td);
});
table.appendChild(tr);
});
// Build the legend using the same retentionColor() function across a
// gradient of sample percentages, so the legend always matches the cells.
var legend = document.getElementById('crhLegend');
var wrap = document.createElement('div');
wrap.style.display = 'flex';
wrap.style.flexDirection = 'column';
wrap.style.gap = '4px';
var swatches = document.createElement('div');
swatches.style.display = 'flex';
swatches.style.gap = '2px';
[0, 20, 40, 60, 80, 100].forEach(function (pct) {
var sw = document.createElement('div');
sw.className = 'crh-legend-cell';
sw.style.background = retentionColor(pct);
swatches.appendChild(sw);
});
var labels = document.createElement('div');
labels.className = 'crh-legend-labels';
labels.innerHTML = '<span>0%</span><span>100%</span>';
wrap.appendChild(swatches);
wrap.appendChild(labels);
legend.appendChild(wrap);Extend with AI
Take This Snippet Further With AI
The AI prompt for this one is for Patreon supporters ($3 a month, 7 days free), along with a site with no ads. Supporters enter the passcode once and it is remembered in this browser.
What's included
Features
About this UI Snippet
Cohort Retention Heatmap — Weekly Retention by Signup Cohort

The cohort retention heatmap is the analytics-dashboard staple for tracking how well a product holds onto users: rows are signup cohorts (one per week), columns are weeks-since-signup, and each cell's color intensity shows what percentage of that cohort is still active. This snippet builds one in plain HTML, CSS, and JavaScript with a genuinely computed color function.
A real percentage-to-color function
The core of the demo is retentionColor(pct), which takes any retention percentage from 0 to 100 and computes an HSLA color from it — hue stays fixed (teal), while saturation, lightness, and alpha are all derived mathematically from the normalized percentage. Nothing is a hardcoded per-cell color or a lookup table; feed the function 37% or 91% and it produces a proportionally different shade every time, which is what makes the grid an honest visualization rather than a set of pre-picked swatches.
Simulated but structured data
Each cohort row is generated with a seeded pseudo-random decay model: retention starts at 100% and multiplies by a per-cohort decay factor each week, with small jitter layered in so the curve looks organic rather than a perfect exponential. Cells for weeks that haven't happened yet for a newer cohort are rendered empty (crh-empty), which is how real retention tables look — the staircase of missing future weeks.
Legend generated from the same function
The legend swatches are built by calling retentionColor() at six sample points (0, 20, 40, 60, 80, 100), so the legend can never drift out of sync with what the cells actually show — change the color function once and both update together.
Hover tooltips
Hovering any populated cell shows a small tooltip positioned relative to the card with the cohort label and the exact retention percentage, so users get precision on demand without cluttering every cell with a wall of text (though the cells do show a compact inline percentage too).
Customizing it
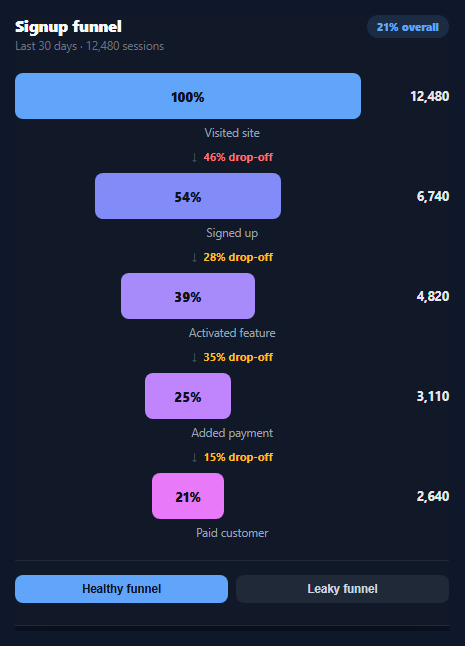
Swap the simulated data for your real cohort table, change the color ramp's hue or curve, add a click handler to drill into a cohort's users, or extend the grid to more weeks. Pair it with a funnel chart for conversion context, an activity heatmap for daily engagement, or a stat comparison card for headline retention KPIs.
Step by step
How to Use
- 1Paste HTML, CSS, and JSThe heatmap card renders with legend, grid, and tooltip.
- 2Hover any populated cellA tooltip shows the cohort and exact percentage.
- 3Check the legendIt's generated from the same color function as the cells.
- 4Swap in real dataReplace the simulated cohorts array with your API response.
- 5Adjust the color rampTune hue, saturation, or alpha in retentionColor().
Real-world uses
Common Use Cases
retentionColor(pct).Got questions?
Frequently Asked Questions
It's computed. Every cell calls retentionColor(pct), which maps the 0-100 percentage to an HSLA string by scaling saturation, lightness, and alpha from the normalized value — there is no lookup table or per-cell hardcoded color. Any percentage you pass in produces a proportionally distinct shade.
A cohort that signed up recently hasn't reached later weeks yet, so those cells are rendered as empty (crh-empty) rather than 0% — showing 0% would incorrectly imply the cohort churned completely when in reality that week simply hasn't happened.
Replace the seeded cohorts/data generation with your own array of { label, values } objects, where values is an array of percentages (or null for not-yet-elapsed weeks) per week-since-signup. The rendering and color logic work unchanged.
Yes — edit the hue, sat, and light formulas inside retentionColor(). Keeping the mapping a function (rather than hardcoding colors) means changing one formula updates every cell and the legend consistently.
Move the cohort data into component state, compute retentionColor(pct) the same way in a helper, and map over cohorts/weeks in your template to render cells instead of building the table with DOM APIs. The tooltip can become local hover state instead of manual event listeners.