

Interact.js Draggable and Resizable Dashboard Panels with Snapping
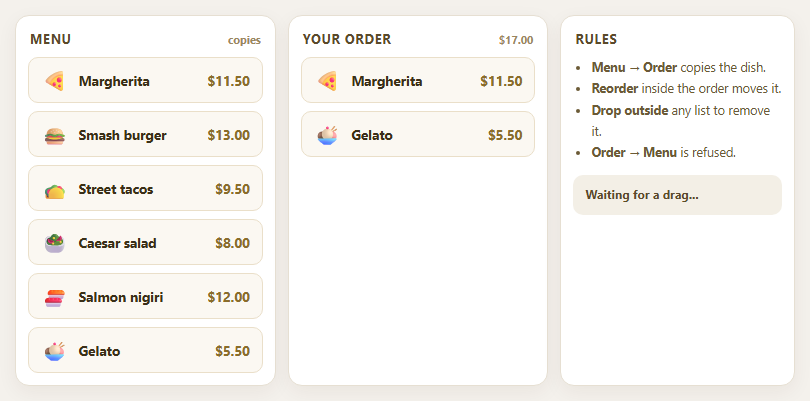
Dragula Copy vs Move Lists with Spill Control

SortableJS Shared Groups: Clone from a Palette into a Page Builder

SortableJS Drag Handle with Pinned and Locked Rows
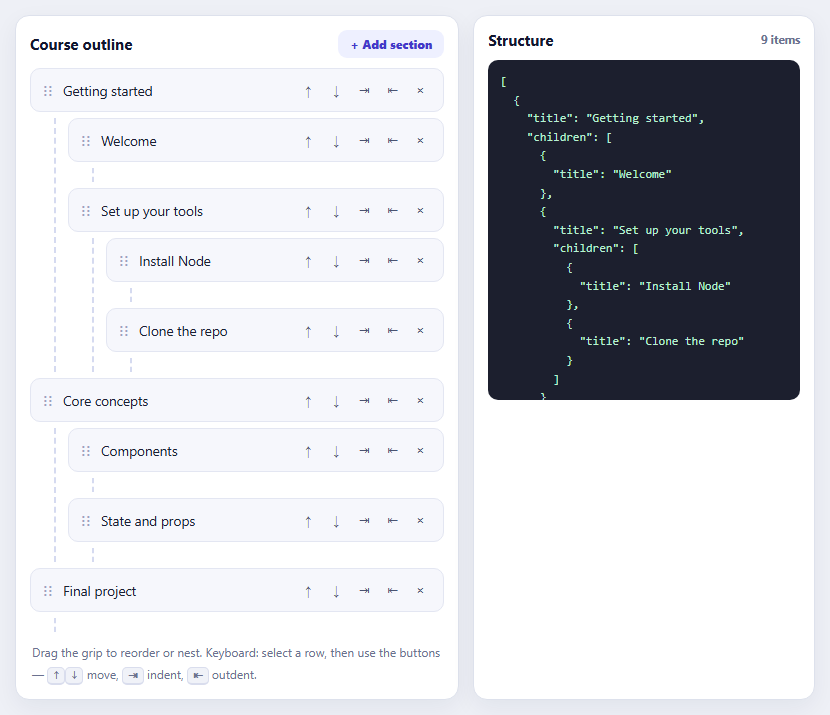
SortableJS Nested Sortable Tree with Keyboard Controls
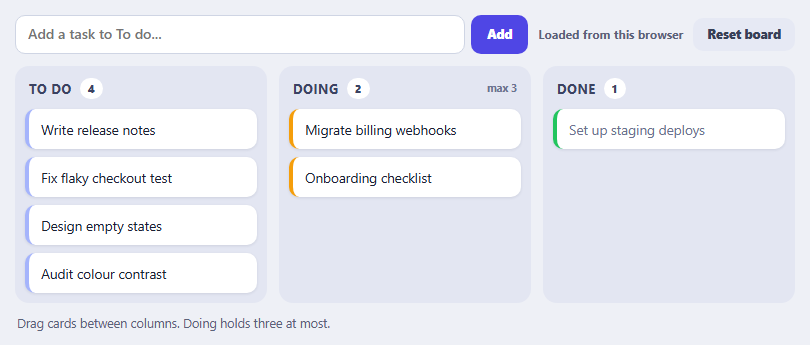
SortableJS Multi-List Kanban with Persistence and WIP Limit
Stat Comparison Card — KPI Trend Card HTML CSS JS
Stat Comparison Card · Dashboards · Plain HTML, CSS & JS · Live preview
Copy & paste
Source Code
<div class="scc-grid" id="sccGrid"></div>*{box-sizing:border-box;margin:0;padding:0}
body{font-family:system-ui,-apple-system,sans-serif;background:#f1f5f9;min-height:100vh;display:flex;align-items:center;justify-content:center;padding:24px}
.scc-grid{display:grid;grid-template-columns:repeat(auto-fit,minmax(210px,1fr));gap:16px;max-width:720px;width:100%}
.scc-card{background:#fff;border-radius:14px;padding:18px;box-shadow:0 8px 24px rgba(15,23,42,.06)}
.scc-top{display:flex;align-items:center;justify-content:space-between;margin-bottom:12px}
.scc-label{font-size:12.5px;font-weight:700;color:#64748b}
.scc-ico{width:34px;height:34px;border-radius:9px;display:flex;align-items:center;justify-content:center;font-size:16px}
.scc-ico.indigo{background:#eef2ff}.scc-ico.green{background:#f0fdf4}.scc-ico.amber{background:#fffbeb}.scc-ico.pink{background:#fdf2f8}
.scc-value{font-size:27px;font-weight:800;color:#0f172a;letter-spacing:-.5px;font-variant-numeric:tabular-nums;line-height:1}
.scc-meta{display:flex;align-items:center;gap:7px;margin-top:10px}
.scc-delta{display:inline-flex;align-items:center;gap:3px;font-size:12px;font-weight:800;padding:2px 7px;border-radius:999px}
.scc-delta.up{background:#dcfce7;color:#15803d}
.scc-delta.down{background:#fee2e2;color:#b91c1c}
.scc-delta.flat{background:#f1f5f9;color:#64748b}
.scc-delta svg{width:12px;height:12px}
.scc-vs{font-size:11.5px;color:#94a3b8}
/* Tiny inline sparkline */
.scc-spark{margin-top:12px;height:34px;width:100%}
.scc-spark path.line{fill:none;stroke-width:2;stroke-linecap:round;stroke-linejoin:round}
.scc-spark path.area{opacity:.12}var STATS = [
{ label: 'Revenue', value: 48200, prev: 41800, fmt: 'usd', icon: '💰', tone: 'indigo', spark: [30,32,31,35,34,38,41,40,44,48] },
{ label: 'New users', value: 1284, prev: 1390, fmt: 'num', icon: '👥', tone: 'green', spark: [22,21,20,19,18,17,16,15,14,13] },
{ label: 'Conversion', value: 3.8, prev: 3.2, fmt: 'pct', icon: '🎯', tone: 'amber', spark: [3.0,3.1,3.0,3.3,3.4,3.5,3.6,3.5,3.7,3.8] },
{ label: 'Avg. session',value: 264, prev: 264, fmt: 'sec', icon: '⏱️', tone: 'pink', spark: [260,262,261,265,263,264,266,263,265,264] },
];
var COLOR = { up: '#22c55e', down: '#ef4444', flat: '#94a3b8' };
function fmtValue(v, type) {
if (type === 'usd') return '$' + Math.round(v).toLocaleString();
if (type === 'pct') return v.toFixed(1) + '%';
if (type === 'sec') { var m = Math.floor(v / 60), s = v % 60; return m + 'm ' + (s < 10 ? '0' : '') + s + 's'; }
return Math.round(v).toLocaleString();
}
function sparkPath(data, w, h) {
var min = Math.min.apply(null, data), max = Math.max.apply(null, data);
var range = max - min || 1;
var step = w / (data.length - 1);
var pts = data.map(function (d, i) { return [i * step, h - ((d - min) / range) * (h - 4) - 2]; });
var line = pts.map(function (p, i) { return (i ? 'L' : 'M') + p[0].toFixed(1) + ' ' + p[1].toFixed(1); }).join(' ');
var area = line + ' L' + w + ' ' + h + ' L0 ' + h + ' Z';
return { line: line, area: area };
}
function render() {
document.getElementById('sccGrid').innerHTML = STATS.map(function (s) {
var diff = s.value - s.prev;
var pct = s.prev === 0 ? 0 : (diff / s.prev) * 100;
var dir = Math.abs(pct) < 0.05 ? 'flat' : pct > 0 ? 'up' : 'down';
var arrow = dir === 'up' ? '<polyline points="18 15 12 9 6 15"/>' : dir === 'down' ? '<polyline points="6 9 12 15 18 9"/>' : '<line x1="6" y1="12" x2="18" y2="12"/>';
var sp = sparkPath(s.spark, 100, 34);
var stroke = COLOR[dir];
return '<div class="scc-card">' +
'<div class="scc-top"><span class="scc-label">' + s.label + '</span><span class="scc-ico ' + s.tone + '">' + s.icon + '</span></div>' +
'<div class="scc-value">' + fmtValue(s.value, s.fmt) + '</div>' +
'<div class="scc-meta">' +
'<span class="scc-delta ' + dir + '"><svg viewBox="0 0 24 24" fill="none" stroke="currentColor" stroke-width="3" stroke-linecap="round" stroke-linejoin="round">' + arrow + '</svg>' + Math.abs(pct).toFixed(1) + '%</span>' +
'<span class="scc-vs">vs last month</span>' +
'</div>' +
'<svg class="scc-spark" viewBox="0 0 100 34" preserveAspectRatio="none">' +
'<path class="area" d="' + sp.area + '" fill="' + stroke + '"/>' +
'<path class="line" d="' + sp.line + '" stroke="' + stroke + '"/>' +
'</svg>' +
'</div>';
}).join('');
}
render();Extend with AI
Take This Snippet Further With AI
The AI prompt for this one is for Patreon supporters ($3 a month, 7 days free), along with a site with no ads. Supporters enter the passcode once and it is remembered in this browser.
What's included
Features
About this UI Snippet
Stat Comparison Card — KPI Value with Period-Over-Period Change & Sparkline

Every analytics dashboard opens with a row of KPI cards, and a good one never shows a number in isolation — it shows the value, how it compares to last period, and the recent trend, so a glance answers "is this good and which way is it heading?" This snippet builds those stat comparison cards in plain HTML, CSS, and vanilla JavaScript: a big value, a color-coded percent-change pill with a direction arrow, a "vs last month" reference, and an inline SVG sparkline — all generated from data.
A number with context, not in a vacuum
Each card pairs the headline value with a delta computed against the previous period ((value − prev) / prev × 100). The delta renders as a pill — green with an up arrow for an increase, red with a down arrow for a decrease, gray with a flat line when essentially unchanged — plus the "vs last month" label so the comparison is explicit. This is the difference between "Revenue: $48,200" (which means nothing alone) and "$48,200, ▲15.3% vs last month" (which is a decision-ready insight).
Direction-aware, not just positive/negative
The card classifies the change into up, down, or *flat* — a change under a small threshold (0.05%) reads as "no real change" rather than a misleadingly precise "▲0.0%". This matters for metrics that hover (like average session time in the demo, which is unchanged): forcing every metric into up-or-down would imply movement that isn't there. And critically, color follows direction, not value — for a metric where down is good (like churn), you'd flip the tone, since "green = good" depends on the metric.
Smart per-metric formatting
Different KPIs need different formats, so fmtValue() handles currency ($48,200 with thousands separators), counts (1,284), percentages (3.8%), and durations (4m 24s) from a fmt flag on each stat. The value, the delta, and the sparkline all derive from the same data object, so a card is fully described by its data — adding a new KPI is one array entry, not new markup.
An inline sparkline built from a path
The mini trend chart is a tiny inline SVG. sparkPath() normalizes the data series to the chart's height (scaling between the series min and max so the shape fills the space), builds an M…L… line path, and closes it into a filled area below. The sparkline's color matches the trend direction, reinforcing the up/down signal visually — a falling metric gets a red line, a rising one green. It's drawn with preserveAspectRatio="none" so it stretches to the card width responsively, and at this size a sparkline conveys "the shape of recent history" far better than any axis-laden chart.
Responsive grid, drop-in ready
The cards sit in an auto-fit grid that reflows from four across down to one on narrow screens. Because everything is data-driven and self-contained, you populate STATS from your analytics API (current value, previous-period value, and a short series for the sparkline) and the whole row renders — values formatted, deltas computed, trends colored, sparklines drawn. The FAQs cover wiring real data and handling metrics where down is the good direction.
Step by step
How to Use
- 1Paste HTML, CSS, and JSA responsive row of KPI cards renders — revenue, users, conversion, and session time — each with a value, change, and sparkline.
- 2Read the deltasEach card shows a colored pill: green ▲ for up, red ▼ for down, gray for essentially unchanged, vs last month.
- 3Note the sparklineThe mini trend line under each value matches the change color, showing the recent shape at a glance.
- 4Check the formattingValues format per metric — currency, counts, percentages, and durations — from the fmt flag.
- 5Edit the statsChange the STATS array (value, prev, fmt, icon, tone, spark) to your KPIs — cards regenerate.
- 6Connect real analyticsPopulate STATS from your analytics API with the current value, previous-period value, and a sparkline series.
Real-world uses
Common Use Cases
fmtValue() handling currency, counts, percentages and durations in one consistent way.Got questions?
Frequently Asked Questions
Populate the STATS array from your analytics API: each entry needs the current value, the previous-period value (prev) for the delta, a fmt flag for formatting, and a short numeric series (spark) for the sparkline. Fetch those on load (and on refresh), assign to STATS, and call render() — every card's value, delta, and trend recompute from the data.
For metrics like churn, bounce rate, or error count, "down" is positive, so invert the color logic for those cards — add an inverted flag to the stat and, when set, map a negative change to the green/up tone and a positive change to red/down. The percent and arrow stay the same; only the color tone flips to reflect that lower is better.
A metric that barely moved shouldn't display a precise "▲0.0%" with an up arrow, which implies meaningful growth. Treating changes below a small threshold as flat (gray, with a neutral line) honestly communicates "no real change," which is more useful than forcing every metric into up or down. Adjust the threshold to your tolerance.
sparkPath() finds the series min and max, normalizes each point to the chart height (so the line fills the vertical space regardless of the values' scale), and builds an SVG path with M/L commands, then closes a filled area below it. preserveAspectRatio="none" stretches it to the card width. Pass any-length series; the path adapts to the number of points.
In React, hold the stats in useState and compute each delta and sparkline path with useMemo, rendering cards with .map(); in Vue, use a computed over a reactive stats array; in Angular, use *ngFor with getters or pipes. The delta, formatting, and sparkline functions are plain JavaScript that port unchanged — only the per-data re-render moves into the framework.