

Funnel Conversion Steps — Free Drop-Off Funnel HTML CSS JS
Funnel Conversion Steps · Charts · Plain HTML, CSS & JS · Live preview
Copy & paste
Source Code
<div class="fcs-card">
  <div class="fcs-head">
    <div>
      <h3>Signup funnel</h3>
      <p>Last 30 days · 12,480 sessions</p>
    </div>
    <span class="fcs-overall" id="fcsOverall">— overall</span>
  </div>

  <div class="fcs-funnel" id="fcsFunnel"></div>

  <div class="fcs-demo">
    <button type="button" data-set="healthy">Healthy funnel</button>
    <button type="button" data-set="leaky">Leaky funnel</button>
  </div>
</div>*{box-sizing:border-box;margin:0;padding:0}
body{font-family:system-ui,-apple-system,sans-serif;background:#0f172a;min-height:100vh;display:flex;align-items:center;justify-content:center;padding:24px}
.fcs-card{background:#111827;border:1px solid #1f2937;border-radius:16px;padding:22px;width:100%;max-width:480px;box-shadow:0 18px 44px rgba(0,0,0,.4)}
.fcs-head{display:flex;align-items:flex-start;justify-content:space-between;margin-bottom:20px}
.fcs-head h3{font-size:15.5px;font-weight:800;color:#f8fafc}
.fcs-head p{font-size:11.5px;color:#6b7280;margin-top:2px}
.fcs-overall{font-size:11px;font-weight:800;padding:4px 10px;border-radius:999px;background:rgba(96,165,250,.14);color:#60a5fa;white-space:nowrap}
.fcs-funnel{display:flex;flex-direction:column;gap:0}
.fcs-stage{position:relative}
.fcs-bar-row{display:flex;align-items:center;gap:12px}
.fcs-bar-wrap{flex:1;display:flex;justify-content:center}
.fcs-bar{height:46px;border-radius:8px;display:flex;align-items:center;justify-content:center;color:#0b1220;font-weight:800;font-size:13px;transition:width .5s cubic-bezier(.4,0,.2,1);min-width:60px}
.fcs-count{width:76px;text-align:right;font-size:12.5px;font-weight:700;color:#e5e7eb;font-variant-numeric:tabular-nums;flex-shrink:0}
.fcs-label{font-size:11.5px;color:#9ca3af;margin-top:6px;text-align:center}
.fcs-drop{display:flex;align-items:center;justify-content:center;gap:6px;padding:8px 0;font-size:11px;font-weight:700;color:#f87171}
.fcs-drop .fcs-drop-arrow{color:#4b5563;font-size:13px}
.fcs-drop.fcs-drop-mild{color:#fbbf24}
.fcs-demo{display:flex;gap:8px;margin-top:20px;border-top:1px solid #1f2937;padding-top:14px}
.fcs-demo button{flex:1;background:#1f2937;border:none;border-radius:8px;padding:8px;font-size:11.5px;font-weight:700;color:#cbd5e1;cursor:pointer;transition:background .15s}
.fcs-demo button:hover{background:#374151}
.fcs-demo button.active{background:#60a5fa;color:#0b1220}var COLORS = ['#60a5fa', '#818cf8', '#a78bfa', '#c084fc', '#e879f9'];
var DATASETS = {
healthy: [
{ label: 'Visited site', count: 12480 },
{ label: 'Signed up', count: 6740 },
{ label: 'Activated feature', count: 4820 },
{ label: 'Added payment', count: 3110 },
{ label: 'Paid customer', count: 2640 },
],
leaky: [
{ label: 'Visited site', count: 12480 },
{ label: 'Signed up', count: 5920 },
{ label: 'Activated feature', count: 1340 },
{ label: 'Added payment', count: 980 },
{ label: 'Paid customer', count: 410 },
],
};
var funnelEl = document.getElementById('fcsFunnel');
var overallEl = document.getElementById('fcsOverall');
function fmt(n) { return n.toLocaleString(); }
function render(stages) {
var maxCount = stages[0].count;
var html = '';
stages.forEach(function (stage, i) {
var pct = Math.max(6, Math.round((stage.count / maxCount) * 100));
var color = COLORS[i % COLORS.length];
html += '<div class="fcs-stage">' +
'<div class="fcs-bar-row">' +
'<div class="fcs-bar-wrap"><div class="fcs-bar" style="width:' + pct + '%;background:' + color + '">' + pct + '%</div></div>' +
'<div class="fcs-count">' + fmt(stage.count) + '</div>' +
'</div>' +
'<div class="fcs-label">' + stage.label + '</div>' +
'</div>';
if (i < stages.length - 1) {
var next = stages[i + 1];
var dropPct = Math.round((1 - next.count / stage.count) * 100);
var mild = dropPct < 40;
html += '<div class="fcs-drop' + (mild ? ' fcs-drop-mild' : '') + '"><span class="fcs-drop-arrow">↓</span> ' + dropPct + '% drop-off</div>';
}
});
funnelEl.innerHTML = html;
var overallPct = Math.round((stages[stages.length - 1].count / stages[0].count) * 100);
overallEl.textContent = overallPct + '% overall';
}
document.querySelector('.fcs-demo').addEventListener('click', function (e) {
var btn = e.target.closest('button');
if (!btn) return;
document.querySelectorAll('.fcs-demo button').forEach(function (b) { b.classList.remove('active'); });
btn.classList.add('active');
render(DATASETS[btn.dataset.set]);
});
document.querySelector('.fcs-demo button[data-set="healthy"]').classList.add('active');
render(DATASETS.healthy);Extend with AI
Take This Snippet Further With AI
The AI prompt for this one is for Patreon supporters ($3 a month, 7 days free), along with a site with no ads. Supporters enter the passcode once and it is remembered in this browser.
What's included
Features
About this UI Snippet
Funnel Conversion Steps — A Stage-by-Stage Drop-Off Visualization
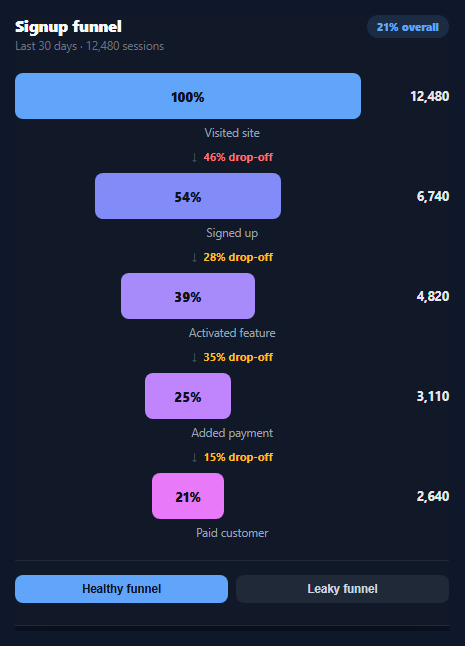
Every product with a signup flow, checkout, or onboarding sequence eventually needs to answer one question: where do people actually leave? A funnel chart answers it visually, showing each stage as a bar sized to its share of the starting cohort, with the percentage lost between consecutive stages called out explicitly. This snippet builds that funnel in plain HTML, CSS, and vanilla JavaScript from a single ordered array of stages, no chart library involved.
Bars sized by count, not by an external scale
Each stage's bar width is computed as a percentage of the *first* stage's count (stage.count / maxCount), clamped to a 6% minimum so even a heavily-dropped-off final stage stays visible and readable. Because every bar is measured against the same reference point, the shrinking width tells an honest visual story — the funnel narrows exactly as fast as users actually leave, and you can see the “gap” between an initial burst of traffic and the trickle that converts.
Drop-off, calculated between neighbors, not against the top
Between every pair of consecutive stages, render() inserts a callout showing what fraction of the *previous* stage's count was lost before the next stage (1 - next.count / stage.count) * 100. This is the number product and growth teams actually act on — a 78% drop between "Activated feature" and "Added payment" points at a specific step to fix, which a single overall conversion number would hide entirely. Drops under 40% render in amber rather than red, so the callouts read as a heat scale rather than uniform alarm.
An overall conversion rate for context
The header badge shows the ratio of the last stage's count to the first — the number a stakeholder skimming a dashboard wants first. It's derived the same way as everything else: computed from the stage data on every render, so switching datasets (via the demo toggle) updates the badge, every bar, and every drop-off label together, with nothing left stale.
Pure SVG-free, CSS-driven bars
The bars are plain divs with an inline width percentage and a CSS transition, so swapping datasets animates the funnel smoothly rather than snapping. No canvas, no SVG paths — just flexbox layout and computed widths, which keeps the markup easy to restyle and trivial to port to a chart library later if the data volume grows.
Two example states, one render function
The demo buttons swap between a healthy funnel (gradual, even drop-off) and a leaky one (a single stage loses most of the cohort) to show how the same render(stages) function reacts to different data. In production, replace the datasets with a real query result — anything shaped as an ordered array of { label, count } renders correctly. Pair it with a stat comparison card for stage-over-stage deltas, or an activity heatmap for when in the funnel users tend to drop.
Step by step
How to Use
- 1Paste HTML, CSS, and JSA five-stage signup funnel renders with shrinking bars and drop-off callouts.
- 2Read the bars top to bottomEach bar's width is proportional to its share of the first stage's count.
- 3Read the drop-off labelsThe percentage between two bars shows how much of the previous stage was lost.
- 4Switch datasetsClick "Healthy funnel" or "Leaky funnel" to see gradual vs. concentrated drop-off.
- 5Check the overall badgeThe header shows the final stage's conversion rate against the first.
- 6Swap in real dataReplace DATASETS with an array of { label, count } objects from your analytics.
Real-world uses
Common Use Cases
Got questions?
Frequently Asked Questions
Every stage's width is a percentage of the first stage's count — stage.count / maxCount — clamped to a 6% minimum so the last stage never disappears visually even after heavy drop-off. Because all bars share the same reference point, the visual narrowing accurately reflects the real proportions rather than each bar being scaled independently.
It's calculated against the immediately preceding stage, not the top of the funnel: 1 - (next stage's count / current stage's count), turned into a percentage. This is the number that matters for diagnosis — it tells you what fraction of people who reached this stage failed to reach the next one, independent of how many people started the funnel overall.
Drop-offs under 40% render in amber and steeper ones in red, so the callouts function as a rough heat scale rather than treating every loss as equally urgent. Adjust the threshold in the mild check inside render() to match what counts as "expected" attrition for your specific funnel.
Yes — the stages array can be any length. render() loops over it and inserts a drop-off callout between every consecutive pair automatically, so adding or removing a stage is a data change with no markup or JS logic edits required.
Pass the stages array as a prop and derive the max count, each bar's percentage, and each drop-off value with a memoized computation (useMemo in React, a computed property in Vue). The percentage math and the drop-off formula are pure functions of the array and port unchanged.