


Chartist.js Animated Bar Race — Growing Bars & update() Snippet
Chartist.js Animated Bar Race · Charts · Plain HTML, CSS & JS · Live preview
Copy & paste
Source Code
<div class="cbr-stage">
  <div class="cbr-head">
    <span class="cbr-tag">Chartist.js · draw event · bar</span>
    <h2>Top Products by Revenue</h2>
    <p>Bars grow in from zero on load, and chart.update() replays the same animation with a fresh shuffle.</p>
  </div>
  <div class="cbr-chart" id="cbrChart"></div>
  <button class="cbr-btn" id="cbrShuffle">Shuffle data</button>
</div>*{box-sizing:border-box;margin:0;padding:0}
body{font-family:system-ui,-apple-system,sans-serif;background:radial-gradient(120% 100% at 50% 0%,#161d38,#080a14);color:#fff;min-height:100vh;display:flex;align-items:center;justify-content:center;padding:24px}
.cbr-stage{width:min(640px,94vw);display:flex;flex-direction:column;gap:20px;background:rgba(255,255,255,.03);border:1px solid rgba(255,255,255,.08);border-radius:18px;padding:28px;box-shadow:0 24px 60px -24px rgba(0,0,0,.8)}
.cbr-head{text-align:center}
.cbr-tag{display:inline-block;font-size:11px;font-weight:700;letter-spacing:.14em;text-transform:uppercase;color:#34d399;background:rgba(52,211,153,.12);border:1px solid rgba(52,211,153,.3);padding:5px 12px;border-radius:99px;margin-bottom:12px}
.cbr-head h2{font-size:clamp(22px,4.4vw,28px);font-weight:800;letter-spacing:-.02em}
.cbr-head p{font-size:13px;color:#8e97b8;margin-top:7px;line-height:1.5}
.cbr-chart{height:280px}
.cbr-chart .ct-label{fill:#c3cbe8;color:#c3cbe8;font-size:.72rem}
.cbr-chart .ct-grid{stroke:rgba(255,255,255,.08)}
.cbr-chart .ct-series-a .ct-bar{stroke:#34d399;stroke-width:22px}
.cbr-chart .ct-bars-labels{fill:#fff;font-weight:700;font-size:.75rem}
.cbr-btn{align-self:center;padding:10px 22px;border-radius:99px;border:1px solid rgba(52,211,153,.4);background:rgba(52,211,153,.12);color:#a7f3d5;font:700 13px system-ui;cursor:pointer;transition:background .18s}
.cbr-btn:hover{background:rgba(52,211,153,.22)}var LABELS = ['Product A', 'Product B', 'Product C', 'Product D', 'Product E'];
function randomSeries() {
return LABELS.map(function () { return Math.round(20 + Math.random() * 80); });
}
var data = { labels: LABELS, series: [randomSeries()] };
var options = {
horizontalBars: true,
axisY: { offset: 90 },
axisX: { onlyInteger: true },
chartPadding: { right: 40 },
high: 100,
low: 0
};
var chart = new Chartist.BarChart('#cbrChart', data, options);
// Bars fire draw with data.type === 'bar'. A horizontal bar's "length" is really its
// x2 coordinate (where it ends along the value axis) versus x1 (where it starts, at
// the axis baseline). Animating a bar in means animating x2 from x1's own value
// (a zero-length bar sitting flush against the baseline) out to its real, final x2.
chart.on('draw', function (data) {
if (data.type === 'bar') {
data.element.animate({
x2: {
id: 'grow',
dur: 800,
from: data.x1,
to: data.x2,
easing: Chartist.Svg.Easing.easeOutQuint
}
});
}
});
// Chartist's own update-transition: calling chart.update() with new data does NOT
// require re-attaching the draw listener or re-running the animation setup above --
// update() re-runs the whole draw pass internally, so every bar refires 'draw' and
// grows in again from its own new x1/x2, this time animating from its OLD rendered
// length to the new one rather than from zero, because Chartist reuses the existing
// DOM elements and only their coordinates change.
document.getElementById('cbrShuffle').addEventListener('click', function () {
chart.update({ labels: LABELS, series: [randomSeries()] });
});Extend with AI
Take This Snippet Further With AI
The AI prompt for this one is for Patreon supporters ($3 a month), along with a site with no ads. Supporters enter the passcode once and it is remembered in this browser.
What's included
Features
About this UI Snippet
Chartist.js Animated Bar Race — Growing Bars and the update() Transition

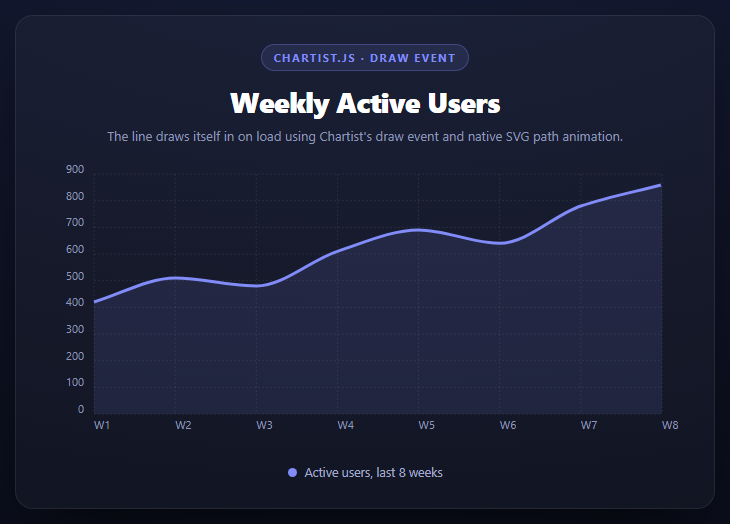
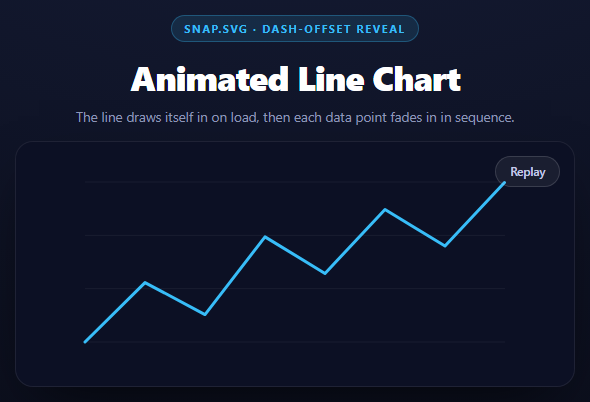
The line and donut snippets in this library animate a static chart once, on load. This one adds a second dimension: what happens when the *data itself* changes after the chart already exists, via chart.update() — and it turns out Chartist has that transition built in almost for free, as long as your draw handler is written the right way.
What a horizontal bar actually is, geometrically
For a Chartist.BarChart with horizontalBars: true, each bar's draw event carries data.x1 and data.x2 — the bar's start and end coordinates along the horizontal value axis (plus y1/y2, which stay constant for a given row since the bar's vertical position doesn't change). x1 is always the axis baseline; x2 is where the bar's value places its far end. A bar's on-screen length is nothing more than x2 - x1.
Growing from zero: animate x2 from x1
js
data.element.animate({
  x2: { dur: 800, from: data.x1, to: data.x2, easing: ... }
});
Setting the animation's from value to data.x1 — the bar's own baseline, not a hardcoded zero — makes the bar start with zero visible length (its start and end coincide) and grow out to its real length. Using data.x1 rather than a literal 0 matters because the baseline position depends on axisY's offset and the chart's padding; hardcoding 0 would grow every bar from the literal left edge of the SVG instead of from the actual axis line, which is wrong the moment the axis has any offset at all.
Why chart.update() replays the animation without extra code
This is the part that looks like magic until you see the mechanism: Chartist doesn't destroy and recreate the SVG on update(). It reuses the existing DOM elements where the shape hasn't structurally changed, and re-runs its internal draw pass, updating each bar's x2 coordinate and — critically — firing the draw event again for every element, exactly as it did on the first render. Because this snippet's chart.on('draw', ...) handler is attached once, outside of any specific render, it doesn't need to be re-attached or re-triggered manually after update() — Chartist calls it again on its own.
The one behavioral difference: on the very first render, data.x1 === the baseline and every bar visibly grows from zero. On a subsequent update(), the bar element already has a real x2 from before the shuffle — but the draw handler still reads whatever data.x1/data.x2 the *new* draw pass computes, and animates between them the same way. In practice this means each shuffle animates every bar from its previous length directly to its new length, which is the actual "race" feeling: bars don't reset to zero and regrow each time, they visibly grow or shrink relative to where they just were.
Why horizontalBars: true suits a "race" layout
Vertical bars racing would need height changes read off y1/y2 instead, but the visual metaphor of a "bar race" — labels on the left, bars extending rightward by value — is a horizontal-bar convention. axisY: { offset: 90 } reserves enough left-hand space for the product name labels to render without truncation.
Step by step
How to Use
- 1Add both Chartist CDN filesThe JS bundle and index.css.
- 2Create a horizontal BarChartnew Chartist.BarChart(selector, data, { horizontalBars: true, ... }).
- 3Animate x2 from x1 on drawdata.type === "bar" gives x1 (baseline) and x2 (real end) to animate between.
- 4Use data.x1, not a literal 0, as the start valueThe baseline position depends on axis offset and padding, so it must be read, not assumed.
- 5Call chart.update() with new dataNo extra animation code is needed — the same draw handler fires again automatically.
- 6Wire a shuffle buttonGenerates fresh random values and calls update(), demonstrating the built-in transition.
Real-world uses
Common Use Cases
Got questions?
Frequently Asked Questions
data.x1 is the bar's actual axis baseline in the chart's current coordinate space, which shifts depending on axisY offset and chart padding. Hardcoding 0 would grow bars from the literal edge of the SVG rather than from the real axis line, which looks wrong as soon as there's any axis offset.
No. The draw event handler attached once with chart.on("draw", ...) fires again automatically every time update() re-runs Chartist's internal render pass, so the exact same x1-to-x2 growth animation replays without any extra setup.
Chartist reuses existing DOM elements on update() rather than destroying and recreating them. The draw handler reads whatever x1/x2 the new render pass computes and animates between those, so a bar that already has a rendered length animates from that length to its new one, not from zero.
For a horizontal bar chart, x1/x2 represent the bar's start and end along the value axis (what changes with the data), while y1/y2 represent its position along the category axis (which stays fixed for a given row). A vertical bar chart would swap which pair encodes the growing length.
The bar-race visual convention is labels on the left with bars extending rightward by value, which is what horizontalBars: true produces. It also makes long product names easier to read than rotated axis labels under vertical bars would.
Auto-scaling recalculates the axis range based on the current data's max value, which would make the same underlying value draw a different bar length on every shuffle. A fixed high/low keeps the scale stable so bar lengths stay visually comparable across updates.