

MapLibre GL 3D Building Extrusion — Free HTML CSS JS Snippet
MapLibre GL 3D Building Extrusion · Misc · Plain HTML, CSS & JS · Live preview
What's included
Features
About this UI Snippet
MapLibre GL 3D Building Extrusion — Turning Flat Polygons into a City
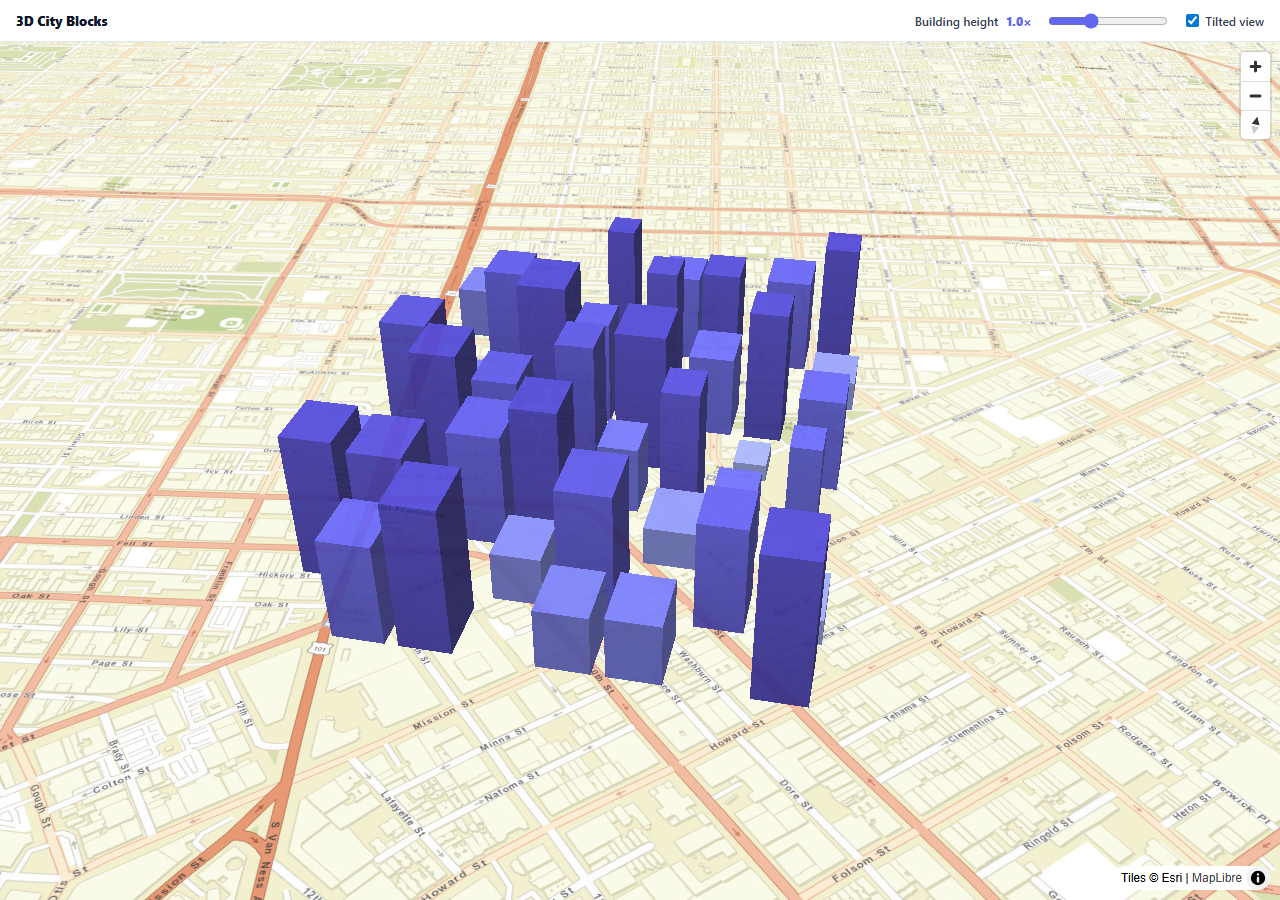
Leaflet renders flat 2D maps; a genuinely tilted, extruded 3D city view needs a WebGL-based renderer, which is exactly what MapLibre GL (the open-source, no-API-key fork of Mapbox GL JS) provides. Its fill-extrusion layer type is the piece that matters here — it takes ordinary flat GeoJSON polygons and renders each one as a real 3D volume, using per-feature properties to decide how tall.
Height comes from the data, per feature, not one fixed number
The paint property 'fill-extrusion-height': ['get', 'height'] is a MapLibre *expression* — it reads a height value out of each individual GeoJSON feature's properties, so every building in the same layer can have its own real height. This is the same shape a real building dataset already comes in (OpenStreetMap's building layer, most municipal GIS exports carry a height or levels field), which is why this synthetic city grid is generated with exactly that property.
The color ramp is also data-driven, via interpolate
['interpolate', ['linear'], ['get', 'height'], 20, '#a5b4fc', 100, '#6366f1', 200, '#3730a3'] maps a building's height to a color along a three-stop gradient — taller buildings render in a darker indigo — computed entirely on the GPU from the same per-feature data, with no JavaScript loop assigning colors one building at a time.
Scaling height re-evaluates the same expression, doesn't touch the data
The height slider doesn't modify the underlying GeoJSON's height values at all — it calls map.setPaintProperty with a new expression, ['*', ['get', 'height'], mult], which multiplies each feature's real height by the current slider value at render time. The data stays the single source of truth; only how it's scaled for display changes.
pitch and bearing are what make it look like a city, not a map
A flat pitch: 0 view would show extruded buildings as flat polygons from directly above — the 3D effect only reads visually once the camera is tilted. pitch: 55 and a slight bearing rotation are what give the initial view its skyline angle, and the toggle animates between a tilted and top-down pitch with easeTo.
Reusing it
Swap the synthetic city grid for a real building GeoJSON dataset (OSM Buildings, a city's open-data portal) with the same height/base properties, and the extrusion, coloring, and scaling all keep working unchanged.
Step by step
How to Use
- 1Add the MapLibre GL CDNLoad maplibre-gl.css and maplibre-gl.js before the snippet's JS runs.
- 2Paste HTML, CSS, and JSA tilted 3D city grid renders with buildings of varying height.
- 3Drag the height sliderEvery building scales up or down together in real time.
- 4Uncheck "Tilted view"The camera eases to a flat, top-down perspective.
- 5Check it againThe camera eases back to the original tilted skyline angle.
- 6Drag to rotate or panStandard MapLibre navigation controls work normally.
Real-world uses
Common Use Cases
Got questions?
Frequently Asked Questions
The fill-extrusion-height paint property is set to the expression ['get', 'height'], which tells MapLibre to read a height value out of each individual GeoJSON feature's own properties object rather than applying one constant number to the whole layer. Every polygon in the source data can therefore extrude to a different real height, exactly the way a real building dataset (which typically includes a height or floor-count field per building) is structured.
The fill-extrusion-color paint property uses an interpolate expression, which is evaluated by MapLibre's GPU-based rendering pipeline directly against each feature's height value at render time. This means the color ramp updates automatically for any data change with no application code iterating over features and computing colors one at a time — the whole computation happens as part of normal WebGL rendering.
No — the underlying GeoJSON source data and its height properties are never changed. The slider calls map.setPaintProperty with a new expression, ['*', ['get', 'height'], mult], which multiplies each feature's real stored height by the current slider value only for rendering purposes. The original data remains the single source of truth, which matters if you need to read the real, unscaled height back out later.
A fill-extrusion layer viewed from directly overhead (pitch: 0) renders extruded buildings as flat polygons, since there's no camera angle from which to see their vertical sides — height differences aren't visible looking straight down. Setting pitch to a non-zero value (55 degrees here) tilts the camera, which is what actually reveals the buildings' vertical extrusion as a recognizable skyline.
Replace the buildCityBlocks() generator with a real GeoJSON source — OpenStreetMap's building footprints (available via Overpass API exports) or a municipal open-data portal's building layer typically already include a height or building:levels property. Map that property name to the height field this snippet's expressions expect (or update the expressions to reference your dataset's actual property names), and the extrusion, coloring, and scaling continue to work unchanged.
Build with AI
Build, Understand, Optimize, and Extend It With AI
You don't have to learn MapLibre's expression syntax from the documentation cold. Paste this snippet's HTML, CSS, and JS into an AI coding assistant like Claude and ask it to explain exactly how the ['get', 'height'] expression reads a per-feature property at render time to give every building its own extrusion height, and how the interpolate expression computes the color ramp entirely on the GPU without any JavaScript looping over features. The same assistant can help optimize it — ask whether generating the synthetic city grid on every page load is fast enough, or whether it should be precomputed and cached as static GeoJSON. It's also useful for extending the effect: ask it to color buildings by a different property (like building type or age instead of height), add a click handler that shows a building's real height in a popup, or animate the extrusion height rising from zero on page load. Treat the code less like a finished artifact and more like a starting point for a conversation.
Prompt to recreate it
Copy this into your AI assistant of choice to build the effect from scratch, or as a jumping-off point for your own variant:
Build a 3D city visualization that extrudes flat GeoJSON polygons into real building volumes using MapLibre GL JS (load MapLibre GL's CSS and JS from a CDN, no other library), in plain HTML, CSS, and JavaScript.

Requirements:
- Generate a synthetic grid of building footprints as GeoJSON polygons, each carrying its own numeric height property with meaningfully varying values (not all buildings the same height), in the same shape a real building dataset (like OpenStreetMap building footprints) would use.
- Render the buildings using the 3D fill-extrusion layer type, with each building's actual extrusion height read from its own height property via a data-driven expression, not one fixed height applied to the whole layer.
- Color each building using a data-driven color gradient/interpolation expression based on its height value (taller buildings a different, more saturated color than shorter ones), computed by the rendering engine itself rather than precomputed in JavaScript.
- Set the initial camera view with a tilted pitch angle (not looking straight down) so the 3D extrusion effect is visually apparent as a skyline.
- Add a height-scale slider that multiplies every building's displayed height by a live-adjustable factor, implemented by updating the height expression's multiplier at render time — the original per-feature height data in the source must not be mutated.
- Add a toggle that smoothly animates the camera between the tilted 3D perspective and a flat, top-down view.
- Include the standard navigation controls (zoom, rotate) so the map can be freely explored.
Want to tighten it up first? Run this prompt through the AI Prompt Studio to score it across 8 quality dimensions, catch anti-patterns, and tune the wording for Claude, ChatGPT, or Gemini before you paste it in.
Source Code
<div class="bx-wrap">
<div class="bx-bar">
<div class="bx-title">3D City Blocks</div>
<label class="bx-slider">
Building height <output id="bxOut">1.0×</output>
<input type="range" id="bxHeight" min="0" max="3" step="0.1" value="1">
</label>
<label class="bx-toggle"><input type="checkbox" id="bxPitch" checked> Tilted view</label>
</div>
<div class="bx-map" id="bxMap"></div>
</div>*{box-sizing:border-box;margin:0;padding:0}
body{font-family:system-ui,-apple-system,sans-serif}
.bx-wrap{height:100vh;min-height:480px;display:flex;flex-direction:column}
.bx-bar{padding:12px 16px;background:#fff;border-bottom:1px solid #e2e8f0;display:flex;align-items:center;gap:18px;flex-wrap:wrap}
.bx-title{font-size:13px;font-weight:800;color:#0f172a;flex:1;min-width:140px}
.bx-slider{display:flex;align-items:center;gap:8px;font-size:12px;font-weight:600;color:#334155}
.bx-slider output{font-weight:800;color:#6366f1;min-width:34px}
.bx-slider input{width:120px;accent-color:#6366f1}
.bx-toggle{display:flex;align-items:center;gap:6px;font-size:12px;font-weight:600;color:#334155}
.bx-map{flex:1}// A synthetic city grid as GeoJSON polygons with a "height" property --
// this is exactly the shape a real building dataset (OSM buildings,
// municipal GIS exports) already comes in, so this snippet swaps in
// directly for real data.
function buildCityBlocks() {
var features = [];
var base = { lng: -122.42, lat: 37.775 };
var cell = 0.0009;
for (var row = 0; row < 8; row++) {
for (var col = 0; col < 8; col++) {
if ((row + col) % 3 === 0) continue; // leave some empty "streets"
var x = base.lng + col * cell;
var y = base.lat + row * cell;
var w = cell * (0.5 + 0.35 * Math.abs(Math.sin(row * col + 1)));
var h = 20 + Math.abs(Math.sin(row * 1.3 + col * 0.7)) * 180;
features.push({
type: 'Feature',
properties: { height: h, base: 0 },
geometry: { type: 'Polygon', coordinates: [[
[x, y], [x + w, y], [x + w, y + w], [x, y + w], [x, y],
]] },
});
}
}
return { type: 'FeatureCollection', features: features };
}
var map = new maplibregl.Map({
container: 'bxMap',
style: {
version: 8,
sources: {
esri: { type: 'raster', tiles: ['https://server.arcgisonline.com/ArcGIS/rest/services/World_Street_Map/MapServer/tile/{z}/{y}/{x}'], tileSize: 256, attribution: 'Tiles © Esri' },
},
layers: [{ id: 'esri', type: 'raster', source: 'esri' }],
},
center: [-122.416, 37.7785],
zoom: 15.5,
pitch: 55,
bearing: -12,
});
map.addControl(new maplibregl.NavigationControl());
map.on('load', function () {
map.addSource('blocks', { type: 'geojson', data: buildCityBlocks() });
// fill-extrusion is the layer type that turns a flat polygon into a 3D
// volume -- height and base are read PER FEATURE from data properties,
// not set as one fixed number for the whole layer.
map.addLayer({
id: 'buildings-3d',
type: 'fill-extrusion',
source: 'blocks',
paint: {
'fill-extrusion-color': ['interpolate', ['linear'], ['get', 'height'], 20, '#a5b4fc', 100, '#6366f1', 200, '#3730a3'],
'fill-extrusion-height': ['get', 'height'],
'fill-extrusion-base': ['get', 'base'],
'fill-extrusion-opacity': 0.92,
},
});
});
var heightSlider = document.getElementById('bxHeight');
var heightOut = document.getElementById('bxOut');
heightSlider.addEventListener('input', function () {
var mult = Number(heightSlider.value);
heightOut.textContent = mult.toFixed(1) + '\u00d7';
if (map.getLayer('buildings-3d')) {
// Multiply the SAME data-driven expression by the slider value --
// the per-feature height data isn't touched, only how it's scaled
// at render time.
map.setPaintProperty('buildings-3d', 'fill-extrusion-height', ['*', ['get', 'height'], mult]);
}
});
document.getElementById('bxPitch').addEventListener('change', function (e) {
map.easeTo({ pitch: e.target.checked ? 55 : 0, duration: 500 });
});