


Pivot Table — Cross-Tab HTML CSS JS (No Library)
Pivot Table · Tables · Plain HTML, CSS & JS · Live preview
Copy & paste
Source Code
<div class="pv-wrap">
  <div class="pv-bar">
    <h3>Sales pivot</h3>
    <label class="pv-agg">Measure
      <select id="pvAgg"><option value="sum">Sum</option><option value="avg">Average</option><option value="count">Count</option></select>
    </label>
  </div>
  <div class="pv-scroll"><table class="pv-table" id="pvTable"></table></div>
</div>*{box-sizing:border-box;margin:0;padding:0}
body{font-family:system-ui,-apple-system,sans-serif;background:#f1f5f9;min-height:100vh;display:flex;align-items:flex-start;justify-content:center;padding:32px 20px}
.pv-wrap{background:#fff;border-radius:14px;width:100%;max-width:600px;box-shadow:0 18px 44px rgba(15,23,42,.08);overflow:hidden}
.pv-bar{display:flex;align-items:center;justify-content:space-between;padding:16px 18px;border-bottom:1px solid #f1f5f9}
.pv-bar h3{font-size:15px;font-weight:800;color:#0f172a}
.pv-agg{font-size:12px;font-weight:700;color:#64748b;display:flex;align-items:center;gap:7px}
.pv-agg select{border:1.5px solid #e2e8f0;border-radius:7px;padding:4px 8px;font-size:12px;font-weight:700;font-family:inherit;color:#0f172a}
.pv-scroll{overflow-x:auto}
.pv-table{width:100%;border-collapse:collapse;font-size:13px;font-variant-numeric:tabular-nums}
.pv-table th,.pv-table td{padding:9px 13px;text-align:right;border-bottom:1px solid #f1f5f9;white-space:nowrap}
.pv-table thead th{background:#f8fafc;font-size:11px;font-weight:800;text-transform:uppercase;letter-spacing:.03em;color:#64748b;border-bottom:1px solid #e2e8f0}
.pv-table th.pv-corner,.pv-table th.pv-rowhead,.pv-table td.pv-rowhead{text-align:left;font-weight:700;color:#0f172a}
.pv-table .pv-cell{color:#334155}
.pv-table tbody tr:hover{background:#f8fafc}
.pv-total,.pv-table tfoot td{font-weight:800;color:#0f172a;background:#f8fafc}
.pv-table tfoot td{border-top:2px solid #e2e8f0}// Flat records — a pivot table cross-tabulates these by row field × column field.
var DATA = [
{ region: 'North', quarter: 'Q1', sales: 120 }, { region: 'North', quarter: 'Q2', sales: 150 },
{ region: 'North', quarter: 'Q3', sales: 90 }, { region: 'North', quarter: 'Q4', sales: 200 },
{ region: 'South', quarter: 'Q1', sales: 80 }, { region: 'South', quarter: 'Q2', sales: 110 },
{ region: 'South', quarter: 'Q3', sales: 140 }, { region: 'South', quarter: 'Q4', sales: 130 },
{ region: 'East', quarter: 'Q1', sales: 200 }, { region: 'East', quarter: 'Q2', sales: 170 },
{ region: 'East', quarter: 'Q3', sales: 160 }, { region: 'East', quarter: 'Q4', sales: 210 },
];
var ROW = 'region', COL = 'quarter', VAL = 'sales';
var table = document.getElementById('pvTable');
var aggSel = document.getElementById('pvAgg');
function uniq(field) { return DATA.reduce(function (a, r) { if (a.indexOf(r[field]) < 0) a.push(r[field]); return a; }, []); }
function aggregate(records, how) {
if (!records.length) return how === 'count' ? 0 : '';
if (how === 'count') return records.length;
var sum = records.reduce(function (s, r) { return s + r[VAL]; }, 0);
return how === 'avg' ? Math.round(sum / records.length) : sum;
}
function render() {
var how = aggSel.value;
var rows = uniq(ROW), cols = uniq(COL);
// Header row: corner + each column value + row total.
var head = '<thead><tr><th class="pv-corner">' + ROW + ' / ' + COL + '</th>' +
cols.map(function (c) { return '<th>' + c + '</th>'; }).join('') + '<th>Total</th></tr></thead>';
// Body: one row per ROW value, a cell per COL value, then the row total.
var body = rows.map(function (rv) {
var cells = cols.map(function (cv) {
var match = DATA.filter(function (r) { return r[ROW] === rv && r[COL] === cv; });
return '<td class="pv-cell">' + aggregate(match, how) + '</td>';
}).join('');
var rowRecs = DATA.filter(function (r) { return r[ROW] === rv; });
return '<tr><td class="pv-rowhead">' + rv + '</td>' + cells + '<td class="pv-total">' + aggregate(rowRecs, how) + '</td></tr>';
}).join('');
// Footer: column totals + grand total.
var foot = '<tfoot><tr><td class="pv-rowhead">Total</td>' +
cols.map(function (cv) {
var colRecs = DATA.filter(function (r) { return r[COL] === cv; });
return '<td>' + aggregate(colRecs, how) + '</td>';
}).join('') +
'<td>' + aggregate(DATA, how) + '</td></tr></tfoot>';
table.innerHTML = head + '<tbody>' + body + '</tbody>' + foot;
}
aggSel.addEventListener('change', render);
render();Extend with AI
Take This Snippet Further With AI
The AI prompt for this one is for Patreon supporters ($3 a month), along with a site with no ads. Supporters enter the passcode once and it is remembered in this browser.
What's included
Features
About this UI Snippet
Pivot Table — Cross-Tabulate Flat Records by Row and Column with Totals
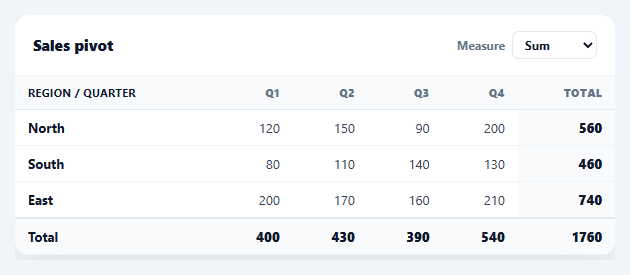
A pivot table turns a flat list of records into a cross-tabulation: pick a field for the rows, a field for the columns, and a measure for the cells, and it summarises the data into a grid with totals — the core of every spreadsheet pivot and BI tool. This snippet builds a working pivot table in plain HTML, CSS, and vanilla JavaScript, aggregating the data itself with switchable sum/average/count measures and full totals — no library.
Cross-tabulation from flat data
The input is a flat array of records (region, quarter, sales). The pivot derives the unique row values and unique column values, then for each row/column intersection filters the records that match both and aggregates them into a cell. This filter-and-aggregate at every intersection is the essence of a pivot — it reshapes one-row-per-event data into a summary matrix, which is exactly what makes raw transactional data readable.
Switchable measures
A selector changes the aggregation across the whole table — sum, average, or count — and re-pivots live. aggregate(records, how) is the single function that defines each measure: count is the record tally, sum totals the value field, average divides the two. Because every cell, row total, column total, and the grand total all route through this one function, switching the measure recomputes the entire grid consistently — there's no chance of the totals using a different calculation than the cells.
Totals on both axes
The table adds a Total column (each row aggregated across all columns), a Total row in the footer (each column aggregated across all rows), and a grand total at their intersection. Crucially, totals are computed from the *raw records*, not by summing the displayed cells — this matters for the average measure, where averaging the cell averages would be wrong; aggregating the underlying records gives the correct overall average. Getting totals right under non-additive measures is the detail that separates a real pivot from a naive grid.
Readable, scrollable layout
Row headers and the corner are left-aligned while numeric cells are right-aligned with tabular figures so columns line up, totals are emphasised with a tinted background, and the table scrolls horizontally if there are many columns. These are the conventions that make a dense numeric grid scannable.
Data-driven and drop-in
Change the ROW, COL, and VAL field names at the top to pivot any flat dataset by different dimensions, or wire those to selectors for a fully interactive pivot. It's a clear, dependency-free reference for the cross-tabulation and aggregation logic behind every pivot table. The filter-per-cell approach here is intentionally simple and easy to follow for a dataset this size; it scans the full DATA array once per intersection, so it's O(rows × cols × records) — fine for dozens of cells, but for a pivot over thousands of records you'd first group records once into a Map keyed by row+col, then read each cell's aggregate from that map in O(1). The same regrouping approach extends naturally to a pivot with more than two dimensions — a third "page" field, say — by keying the map on all three values and adding a selector that filters which page's slice is currently rendered, without changing how the row/column grid itself is built.
Step by step
How to Use
- 1Paste HTML, CSS, and JSA pivot table renders, cross-tabulating sales by region (rows) and quarter (columns).
- 2Switch the measureUse the Measure selector to re-pivot as sum, average, or count.
- 3Read the totalsA Total column, Total row, and grand total summarise both axes.
- 4Change the dimensionsEdit the ROW, COL, and VAL field names to pivot by different fields.
- 5Swap in your dataReplace the flat DATA array with your own records.
- 6Make it interactiveWire ROW/COL/VAL to selectors to let users choose the pivot dimensions.
Real-world uses
Common Use Cases
Got questions?
Frequently Asked Questions
A normal table shows one row per record. A pivot table cross-tabulates: it picks a field for the rows and a field for the columns, then summarises a measure at each intersection. This reshapes flat, one-row-per-event data into a compact summary grid — turning, say, twelve sales records into a region-by-quarter matrix with totals.
For additive measures like sum or count, summing the cells happens to give the right total. But for average, averaging the displayed cell-averages is mathematically wrong — it ignores how many records each cell represents. Aggregating the underlying raw records for every total guarantees correctness across all measures, which is essential for a trustworthy pivot.
Change the ROW, COL, and VAL constants to the field names you want as rows, columns, and the measured value. The code derives the unique values and aggregates generically, so any flat dataset pivots by any of its fields. To make it interactive, bind those constants to dropdowns and call render() on change.
Yes — the grid is generated from the unique values in your data, so it scales to any number of rows and columns, and the container scrolls horizontally when columns overflow. For very large datasets you'd precompute the aggregation once (e.g. group records into a map keyed by row+column) instead of filtering per cell, but the logic is the same.
In React, hold the data and measure in state and compute the pivoted structure with useMemo, then render the grid from it; in Vue, use a computed pivot object with v-for; in Angular, a getter with *ngFor. The uniq()/aggregate() cross-tab logic is framework-agnostic — only the measure state and rendering move into the framework.