


Cell Range Select & Copy Table — Spreadsheet-Style JS
Cell Range Select & Copy Table · Tables · Plain HTML, CSS & JS · Live preview
Copy & paste
Source Code
<div class="rs-wrap">
  <div class="rs-head">
    <h3>Quarterly Revenue ($000s)</h3>
    <button type="button" id="rsCopy">Copy selection</button>
  </div>
  <p class="rs-hint">Click and drag across cells to select a range, or click one cell then Shift+Arrow keys to extend it.</p>

  <div class="rs-scroll">
    <table class="rs-table" id="rsTable">
      <thead>
        <tr><th></th><th>Q1</th><th>Q2</th><th>Q3</th><th>Q4</th></tr>
      </thead>
      <tbody>
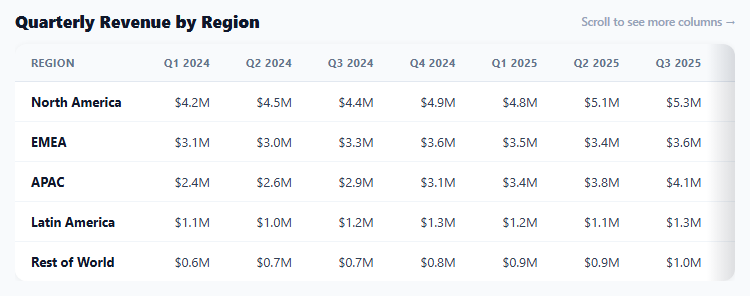
        <tr><th>North</th><td data-v="182">182</td><td data-v="201">201</td><td data-v="176">176</td><td data-v="229">229</td></tr>
        <tr><th>South</th><td data-v="140">140</td><td data-v="158">158</td><td data-v="163">163</td><td data-v="171">171</td></tr>
        <tr><th>East</th><td data-v="95">95</td><td data-v="104">104</td><td data-v="99">99</td><td data-v="118">118</td></tr>
        <tr><th>West</th><td data-v="211">211</td><td data-v="198">198</td><td data-v="220">220</td><td data-v="244">244</td></tr>
        <tr><th>Online</th><td data-v="302">302</td><td data-v="318">318</td><td data-v="340">340</td><td data-v="389">389</td></tr>
      </tbody>
    </table>
  </div>

  <div class="rs-statusbar">
    <span id="rsRange">No selection</span>
    <span class="rs-sep">·</span>
    <span id="rsSum">Sum: —</span>
    <span class="rs-flash" id="rsFlash">Copied!</span>
  </div>
</div>
* { box-sizing: border-box; margin: 0; padding: 0; }
body { font-family: system-ui, sans-serif; background: #f8fafc; padding: 26px 16px; }
.rs-wrap { max-width: 640px; margin: 0 auto; background: #fff; border: 1px solid #e2e8f0; border-radius: 14px; padding: 18px 20px 0; user-select: none; }
.rs-head { display: flex; align-items: center; justify-content: space-between; margin-bottom: 4px; }
.rs-head h3 { font-size: 15px; font-weight: 800; color: #1e293b; }
.rs-head button { border: none; background: #4f46e5; color: #fff; font-size: 12.5px; font-weight: 700; padding: 8px 14px; border-radius: 8px; cursor: pointer; font-family: inherit; }
.rs-head button:hover { background: #4338ca; }
.rs-hint { font-size: 12px; color: #94a3b8; margin-bottom: 14px; }
.rs-scroll { overflow-x: auto; }
.rs-table { border-collapse: collapse; width: 100%; }
.rs-table th, .rs-table td { border: 1px solid #e2e8f0; padding: 8px 12px; font-size: 13px; text-align: right; }
.rs-table thead th { background: #f8fafc; color: #64748b; font-size: 11px; font-weight: 800; text-transform: uppercase; text-align: center; }
.rs-table tbody th { text-align: left; color: #1e293b; font-weight: 700; background: #f8fafc; }
.rs-table td { color: #334155; cursor: cell; }
.rs-table td.selected { background: #e0e7ff; }
.rs-table td.active { outline: 2px solid #4f46e5; outline-offset: -2px; }
.rs-statusbar { display: flex; align-items: center; gap: 8px; padding: 12px 2px 16px; font-size: 12px; color: #64748b; font-weight: 600; }
.rs-sep { opacity: .5; }
.rs-flash { color: #16a34a; opacity: 0; transition: opacity .2s; }
.rs-flash.show { opacity: 1; }var table = document.getElementById('rsTable');
var body = table.tBodies[0];
var rows = Array.prototype.slice.call(body.rows);
var grid = rows.map(function (r) { return Array.prototype.slice.call(r.cells).filter(function (c) { return c.tagName === 'TD'; }); });
var nRows = grid.length, nCols = grid[0].length;
var anchor = null; // { r, c } where selection began
var active = { r: 0, c: 0 };
var isDragging = false;
var rangeLabel = document.getElementById('rsRange');
var sumLabel = document.getElementById('rsSum');
var flash = document.getElementById('rsFlash');
var copyBtn = document.getElementById('rsCopy');
function cellAt(r, c) { return grid[r][c]; }
function bounds(a, b) {
return {
r0: Math.min(a.r, b.r), r1: Math.max(a.r, b.r),
c0: Math.min(a.c, b.c), c1: Math.max(a.c, b.c),
};
}
function paintSelection() {
grid.forEach(function (row) { row.forEach(function (cell) { cell.classList.remove('selected', 'active'); }); });
if (!anchor) return;
var b = bounds(anchor, active);
var sum = 0, count = 0;
for (var r = b.r0; r <= b.r1; r++) {
for (var c = b.c0; c <= b.c1; c++) {
cellAt(r, c).classList.add('selected');
var val = parseFloat(cellAt(r, c).dataset.v);
if (!isNaN(val)) { sum += val; count++; }
}
}
cellAt(active.r, active.c).classList.add('active');
var rowSpan = b.r1 - b.r0 + 1, colSpan = b.c1 - b.c0 + 1;
rangeLabel.textContent = rowSpan + ' row' + (rowSpan === 1 ? '' : 's') + ' \u00d7 ' + colSpan + ' col' + (colSpan === 1 ? '' : 's') + ' selected';
sumLabel.textContent = 'Sum: ' + (count ? sum.toLocaleString() : '—');
}
function findCoords(td) {
for (var r = 0; r < nRows; r++) {
var c = grid[r].indexOf(td);
if (c !== -1) return { r: r, c: c };
}
return null;
}
table.addEventListener('mousedown', function (e) {
var td = e.target.closest('td');
if (!td) return;
var coords = findCoords(td);
if (!coords) return;
isDragging = true;
anchor = coords;
active = coords;
paintSelection();
e.preventDefault();
});
table.addEventListener('mouseover', function (e) {
if (!isDragging) return;
var td = e.target.closest('td');
if (!td) return;
var coords = findCoords(td);
if (!coords) return;
active = coords;
paintSelection();
});
document.addEventListener('mouseup', function () { isDragging = false; });
table.addEventListener('keydown', function (e) {
if (!anchor) return;
var deltas = { ArrowUp: [-1, 0], ArrowDown: [1, 0], ArrowLeft: [0, -1], ArrowRight: [0, 1] };
var d = deltas[e.key];
if (!d) return;
e.preventDefault();
var next = {
r: Math.min(nRows - 1, Math.max(0, active.r + d[0])),
c: Math.min(nCols - 1, Math.max(0, active.c + d[1])),
};
active = next;
if (!e.shiftKey) anchor = next;
paintSelection();
cellAt(active.r, active.c).focus();
});
grid.forEach(function (row) { row.forEach(function (cell) { cell.tabIndex = -1; }); });
cellAt(0, 0).tabIndex = 0;
function selectionText() {
if (!anchor) return '';
var b = bounds(anchor, active);
var lines = [];
for (var r = b.r0; r <= b.r1; r++) {
var cells = [];
for (var c = b.c0; c <= b.c1; c++) cells.push(cellAt(r, c).textContent.trim());
lines.push(cells.join('\t'));
}
return lines.join('\n');
}
function copySelection() {
var text = selectionText();
if (!text) return;
var done = function () {
flash.classList.add('show');
setTimeout(function () { flash.classList.remove('show'); }, 1200);
};
if (navigator.clipboard && navigator.clipboard.writeText) {
navigator.clipboard.writeText(text).then(done).catch(done);
} else {
done();
}
}
copyBtn.addEventListener('click', copySelection);
document.addEventListener('keydown', function (e) {
if ((e.ctrlKey || e.metaKey) && e.key.toLowerCase() === 'c' && anchor) {
var sel = window.getSelection();
if (sel && sel.toString()) return;
copySelection();
}
});
anchor = { r: 0, c: 0 };
active = { r: 0, c: 0 };
paintSelection();Extend with AI
Take This Snippet Further With AI
The AI prompt for this one is for Patreon supporters ($3 a month, 7 days free), along with a site with no ads. Supporters enter the passcode once and it is remembered in this browser.
What's included
Features
About this UI Snippet
Cell Range Select & Copy Table — Rectangular Selection, Shift+Arrow Extension & Clipboard Copy

Selecting a row at a time is not how anyone actually reads a spreadsheet — real spreadsheet software lets you drag a rectangular block of cells, extend it with the keyboard, see a live sum in the status bar, and copy the block out as tab-separated text that pastes cleanly into another sheet. This snippet rebuilds that exact interaction model on top of a plain HTML <table>, entirely in vanilla JavaScript.
Two coordinates, not one, drive the whole selection
The selection state is just two { r, c } coordinate objects: anchor, set the moment a drag or click begins and held fixed for the rest of that gesture, and active, updated continuously as the mouse moves or an arrow key is pressed. bounds(anchor, active) takes the min and max of both coordinates' rows and columns, which is what turns two arbitrary corner points into a normalized rectangle regardless of which direction the user dragged — dragging up-and-left produces the identical rectangle as dragging down-and-right from the mirrored starting cell.
Dragging a rectangle with mousedown/mouseover/mouseup
mousedown on a <td> sets both anchor and active to that cell's coordinates and flips an isDragging flag. While dragging, a mouseover listener on the whole table updates only active to whatever cell the pointer is currently over, repainting the rectangle on every move — this is the standard "hover during a mousedown-held drag" technique for rectangular selection, and it works without any pointer-capture because the listener is attached to the table itself rather than to individual cells, so the browser's native mouseover bubbling does all the cell-tracking work.
Extending the selection from the keyboard
Arrow keys move active by one cell in the pressed direction, clamped to the grid's bounds. Held alone, an arrow key also resets anchor to the new active position — a single-cell move, exactly like clicking a fresh cell. Held with Shift, anchor is left untouched, so the rectangle grows or shrinks from the original starting corner exactly the way Excel and Google Sheets behave, letting a user build a precise multi-cell selection with the keyboard alone.
A live sum, because that is what a status bar is for
Every repaint walks every cell inside the current rectangle, parsing each one's data-v attribute (a clean numeric value kept separate from the cell's display text) and accumulating a running total and count. The status bar shows both the shape of the selection (3 rows × 2 cols) and its numeric sum — the same "selection summary" behavior spreadsheet software has had in its status bar for decades, implemented here in about a dozen lines.
Copying out as tab-separated text
selectionText() walks the same bounded rectangle and joins each row's cell text with a tab character, then joins the rows with a newline — precisely the format Excel, Google Sheets, and most other grid software both produce and expect on paste. navigator.clipboard.writeText() writes that string to the system clipboard, so a range copied out of this table pastes as real, correctly-shaped rows and columns into an actual spreadsheet, not one long comma-separated string.
Step by step
How to Use
- 1Click and drag across cellsPress down on a cell and drag to any other cell — every cell inside the rectangle between the two lights up as selected.
- 2Extend with Shift+ArrowClick one cell, then hold Shift and press an arrow key to grow the selection rectangle from that starting corner without touching the mouse.
- 3Move without extendingPress an arrow key without Shift to move to a single new cell and start a fresh selection from there.
- 4Read the live sumThe status bar below the table reports the selected shape (rows × columns) and the numeric sum of every selected cell.
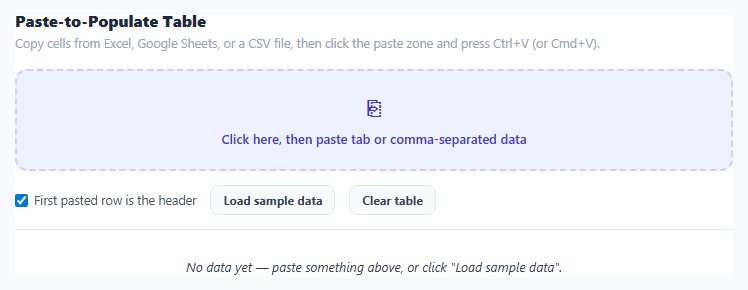
- 5Copy the selectionClick "Copy selection" or press Ctrl+C (Cmd+C on Mac) to copy the selected cells to your system clipboard as tab-separated rows.
- 6Paste into a real spreadsheetPaste directly into Excel or Google Sheets — the tab-and-newline format is read as proper rows and columns, not one run-on line.
Real-world uses
Common Use Cases
Got questions?
Frequently Asked Questions
The selection is tracked as two coordinates — anchor (fixed at drag start) and active (updated continuously). bounds() takes the min and max of both coordinates' row and column independently, which normalizes any drag direction (up-left, down-right, or anything between) into the same correct rectangle between the two corners.
Attaching one mouseover listener to the table and reading e.target.closest("td") relies on native event bubbling to identify whichever cell the pointer is currently over, which is both simpler and cheaper than attaching and managing a separate listener on every individual cell, especially as the table grows.
A plain arrow key press resets anchor to match the new active cell, producing a fresh single-cell selection. Holding Shift leaves anchor untouched, so the rectangle grows or shrinks from the original starting corner — exactly how Excel and Google Sheets extend selections from the keyboard.
Keeping a clean numeric value separate from the cell's display text means the sum calculation stays exact even if the display text later gains formatting like currency symbols, thousands separators, or units — parseFloat on a formatted string like "$1,200" would silently produce the wrong number.
Tab-separated, newline-delimited text is the format spreadsheet software both produces when you copy a range and expects when you paste one — pasting it back into Excel or Google Sheets lands as real distinct rows and columns. Comma-separated text would either paste as one column with commas inside it, or misparse if any cell value itself contains a comma.
Yes. Keep anchor and active in component state, derive the selected-cell set and sum from them on every render, and attach the same mousedown/mouseover/keydown handlers to the table element via refs — the coordinate and bounds math is framework-agnostic.