
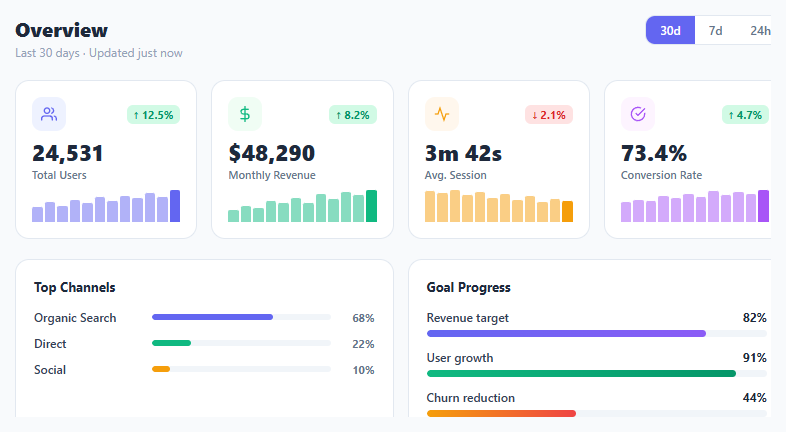
Metric KPI Card Grid

Interact.js Draggable and Resizable Dashboard Panels with Snapping
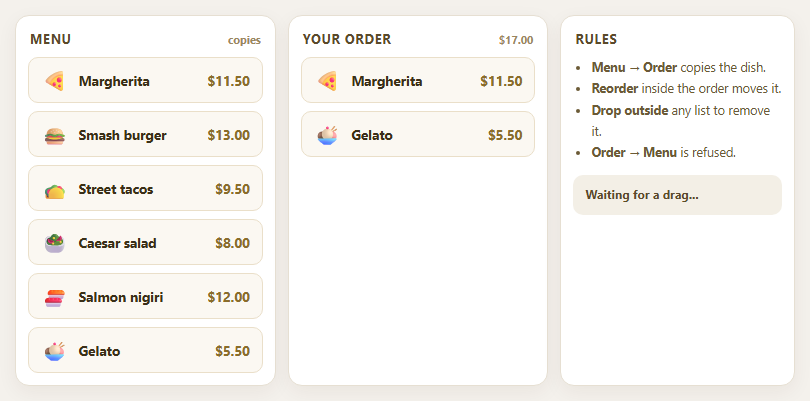
Dragula Copy vs Move Lists with Spill Control

SortableJS Shared Groups: Clone from a Palette into a Page Builder

SortableJS Drag Handle with Pinned and Locked Rows
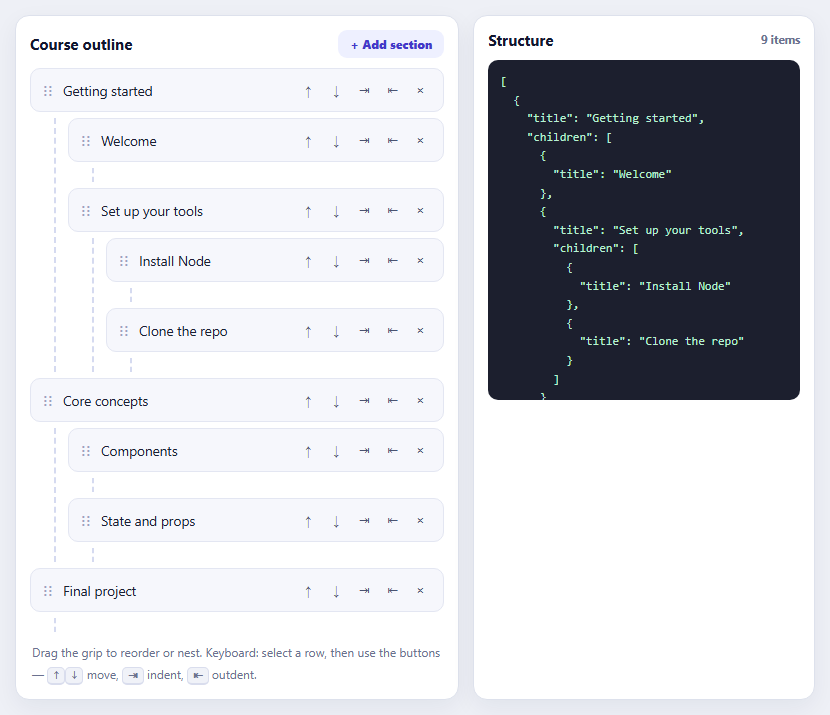
SortableJS Nested Sortable Tree with Keyboard Controls
User Stats Card — Free HTML CSS JS Snippet
User Stats Card · Dashboards · Plain HTML, CSS & JS · Live preview
Copy & paste
Source Code
<div class="scene">
  <div class="card">
    <div class="card-top">
      <div class="user">
        <div class="avatar">PS</div>
        <div>
          <div class="name">Puneet Sharma</div>
          <div class="handle">@webdevpuneet</div>
        </div>
      </div>
      <button class="follow">Follow</button>
    </div>
    <div class="bio">Full-stack developer · UI/UX enthusiast · Building open-source tools for the web.</div>
    <div class="stats">
      <div class="stat"><span class="val">248</span><span class="key">Projects</span></div>
      <div class="stat"><span class="val">12.4k</span><span class="key">Followers</span></div>
      <div class="stat"><span class="val">891</span><span class="key">Following</span></div>
      <div class="stat"><span class="val">4.9★</span><span class="key">Rating</span></div>
    </div>
    <div class="activity">
      <div class="activity-label">Activity — last 12 weeks</div>
      <div class="heatmap" id="heatmap"></div>
    </div>
    <div class="skills">
      <span class="skill">React</span><span class="skill">TypeScript</span>
      <span class="skill">CSS</span><span class="skill">Node.js</span>
      <span class="skill">+8 more</span>
    </div>
  </div>
</div>
* { box-sizing: border-box; margin: 0; padding: 0; }
body { font-family: system-ui, sans-serif; background: #f1f5f9; display: flex; align-items: center; justify-content: center; min-height: 100vh; padding: 20px; }
.card { background: #fff; border-radius: 18px; padding: 22px; width: 320px; box-shadow: 0 4px 24px rgba(0,0,0,0.08); display: flex; flex-direction: column; gap: 16px; }
.card-top { display: flex; align-items: center; justify-content: space-between; }
.user { display: flex; align-items: center; gap: 10px; }
.avatar { width: 44px; height: 44px; border-radius: 50%; background: linear-gradient(135deg,#6366f1,#8b5cf6); color: #fff; font-size: 14px; font-weight: 700; display: flex; align-items: center; justify-content: center; }
.name { font-size: 14px; font-weight: 700; color: #1e293b; }
.handle { font-size: 12px; color: #94a3b8; }
.follow { padding: 6px 16px; font-size: 12px; font-weight: 700; border-radius: 20px; border: 1.5px solid #6366f1; color: #6366f1; background: none; cursor: pointer; font-family: inherit; transition: all 0.15s; }
.follow:hover { background: #6366f1; color: #fff; }
.bio { font-size: 13px; color: #475569; line-height: 1.6; }
.stats { display: grid; grid-template-columns: repeat(4,1fr); text-align: center; background: #f8fafc; border-radius: 10px; padding: 12px 0; }
.stat { display: flex; flex-direction: column; gap: 2px; }
.val { font-size: 15px; font-weight: 800; color: #1e293b; }
.key { font-size: 10px; color: #94a3b8; text-transform: uppercase; letter-spacing: 0.3px; }
.activity { display: flex; flex-direction: column; gap: 8px; }
.activity-label { font-size: 11px; font-weight: 600; color: #94a3b8; }
.heatmap { display: flex; gap: 3px; }
.hm-col { display: flex; flex-direction: column; gap: 3px; }
.hm-cell { width: 10px; height: 10px; border-radius: 2px; }
.skills { display: flex; flex-wrap: wrap; gap: 6px; }
.skill { font-size: 11px; font-weight: 600; padding: 3px 9px; border-radius: 6px; background: #f1f5f9; color: #475569; border: 1px solid #e2e8f0; }const levels = ['#e2e8f0','#bfdbfe','#93c5fd','#60a5fa','#3b82f6','#1d4ed8'];
const heatmap = document.getElementById('heatmap');
for (let col = 0; col < 12; col++) {
const div = document.createElement('div');
div.className = 'hm-col';
for (let row = 0; row < 7; row++) {
const cell = document.createElement('div');
cell.className = 'hm-cell';
cell.style.background = levels[Math.floor(Math.random() * levels.length)];
div.appendChild(cell);
}
heatmap.appendChild(div);
}Extend with AI
Take This Snippet Further With AI
The AI prompt for this one is for Patreon supporters ($3 a month), along with a site with no ads. Supporters enter the passcode once and it is remembered in this browser.
What's included
Features
About this UI Snippet
User Stats Card — Activity Heatmap, Progress Arc & Follow Toggle
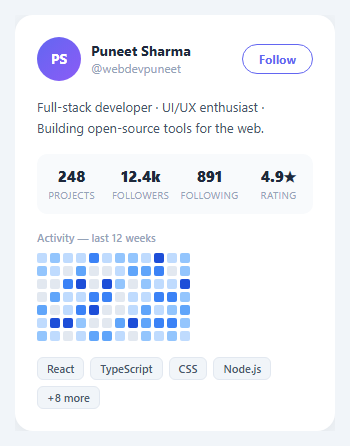
A user stats card displays a developer profile with activity metrics, a contribution heatmap, skill progress, and social stats. Used on portfolio sites, developer dashboards, and community platforms.
The activity heatmap
The heatmap is built from DOM elements, not canvas. A JS loop creates 12 columns × 7 rows of divs. Each div gets a random background colour from the levels array (from light grey to deep blue) simulating contribution frequency. The break-inside: avoid CSS on cells prevents grid rows from wrapping.
Circular progress bar
The skill progress uses the same SVG stroke-dashoffset technique as the SVG Progress Ring snippet: stroke-dasharray: CIRCUMFERENCE and stroke-dashoffset: CIRCUMFERENCE * (1 - pct/100). The ring animates from 0 to the target value on page load.
Follow button toggle
The follow button toggles between "Follow" and "Following" states via .following class — the same pattern as the Social Post Card snippet.
The activity heatmap
The contribution heatmap is a 52-week × 7-day grid of small squares. Each square corresponds to one day. The colour intensity (from light grey to deep indigo) represents activity count on that day — 0 activity is the lightest; maximum activity is the darkest. JavaScript generates the grid using nested loops: for each week (column), create 7 day squares and append to the grid container. Random or real activity data determines each square's colour class.
The circular progress rings
Multiple SVG progress rings use the stroke-dashoffset technique to show different skill or metric percentages. Each ring has a different radius, colour, and target value. The rings animate simultaneously when the component mounts or scrolls into view. See the SVG Progress Ring snippet in this library for the full mathematics explanation.
The follow button state
The follow button toggles between "Follow" and "Following" states using a CSS class and a click handler. The button border and text colour change on toggle. In a real app, the click triggers a POST request to your follow API endpoint. Revert to "Follow" if the API call fails — the same optimistic update pattern as the social post card like button.
GitHub-style profile integration
For a developer portfolio using real GitHub data: fetch the GitHub GraphQL API with your personal access token to get contribution calendar data. Map the contributionCalendar weeks array to the heatmap grid. The contributionsByDay values map directly to colour intensity levels. Update the streak and total contribution counts from the API response summary fields.
The activity heatmap
The contribution heatmap is a 52-week × 7-day grid of small squares. Each square corresponds to one day. The colour intensity (from light grey to deep indigo) represents activity count on that day — 0 activity is the lightest; maximum activity is the darkest. JavaScript generates the grid using nested loops: for each week (column), create 7 day squares and append to the grid container. Random or real activity data determines each square's colour class.
The circular progress rings
Multiple SVG progress rings use the stroke-dashoffset technique to show different skill or metric percentages. Each ring has a different radius, colour, and target value. The rings animate simultaneously when the component mounts or scrolls into view. See the SVG Progress Ring snippet in this library for the full mathematics explanation.
The follow button state
The follow button toggles between "Follow" and "Following" states using a CSS class and a click handler. The button border and text colour change on toggle. In a real app, the click triggers a POST request to your follow API endpoint. Revert to "Follow" if the API call fails — the same optimistic update pattern as the social post card like button.
GitHub-style profile integration
For a developer portfolio using real GitHub data: fetch the GitHub GraphQL API with your personal access token to get contribution calendar data. Map the contributionCalendar weeks array to the heatmap grid. The contributionsByDay values map directly to colour intensity levels. Update the streak and total contribution counts from the API response summary fields.
Step by step
How to Use
- 1Load the snippetClick "User Stats Card" in the sidebar. The preview shows the profile card with heatmap, progress ring, and stats.
- 2Update user infoIn the HTML panel, change the avatar initials, username, handle, and bio text.
- 3Update heatmap dataIn the JS panel, change the levels array colours and the random generation logic to reflect real contribution data.
- 4Change progress ring percentageUpdate the data-pct attribute on the SVG .fill circle to your target percentage.
- 5Update follower statsChange the stat numbers (followers, following, repos) in the HTML stats row.
- 6Export in your formatClick "HTML" for a standalone file, "JSX" for a React component, or "Tailwind" for a React + Tailwind version.
Real-world uses
Common Use Cases
Got questions?
Frequently Asked Questions
A JS loop creates 12 columns × 7 rows of divs. Each div gets a random background colour from the levels array (6 shades from grey to deep blue). The grid uses CSS flexbox with flex-wrap to arrange them in a grid pattern.
It uses SVG stroke-dashoffset: CIRCUMFERENCE * (1 - pct/100). The ring starts at full offset (hidden) and animates to the target offset. This is identical to the SVG Progress Ring snippet technique.
Yes. Replace Math.random() with your actual contribution counts. Map the count to a level index: Math.min(5, Math.floor(count / maxCount * 5)). Apply the corresponding level colour.
Update the levels array with your colour scale. The array goes from least active (index 0) to most active (index 5). Any 6-colour scale works.
Yes. Click "JSX" for a React component. Render the heatmap by mapping a 2D data array to div elements. Pass activity data as props.
Add a title attribute to each heatmap div: div.title = date + ": " + count + " contributions". The browser renders a native tooltip on hover.