
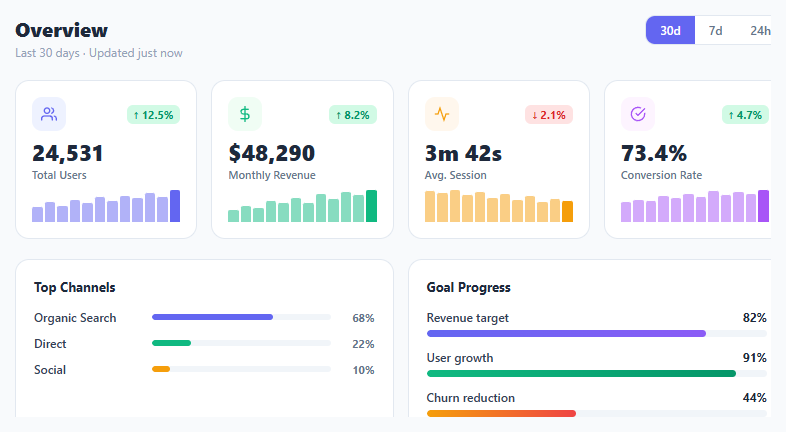
Metric KPI Card Grid

Interact.js Draggable and Resizable Dashboard Panels with Snapping
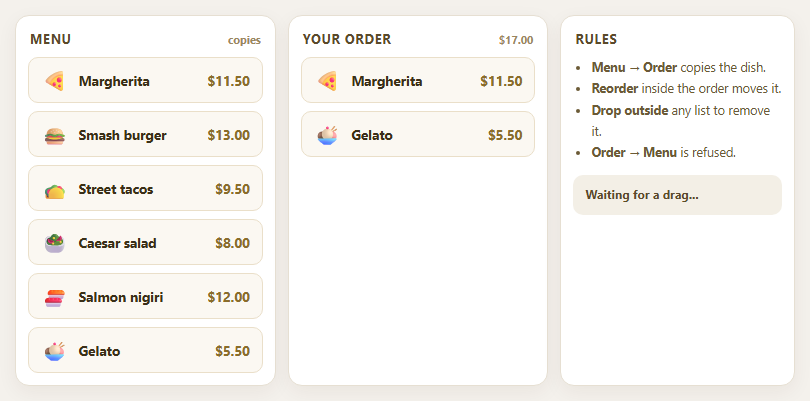
Dragula Copy vs Move Lists with Spill Control

SortableJS Shared Groups: Clone from a Palette into a Page Builder

SortableJS Drag Handle with Pinned and Locked Rows
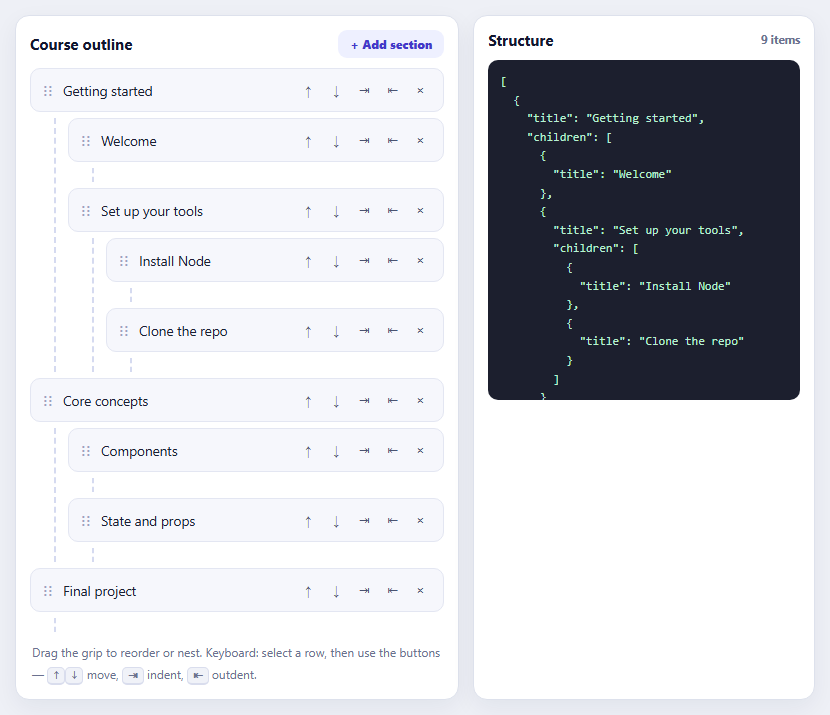
SortableJS Nested Sortable Tree with Keyboard Controls
Budget Tracker Card — Spending by Category HTML/CSS/JS
Budget Tracker Card · Dashboards · Plain HTML, CSS & JS · Live preview
Copy & paste
Source Code
<div class="bt-card">
  <div class="bt-head">
    <div>
      <h3>Monthly budget</h3>
      <p>June 2026</p>
    </div>
    <div class="bt-total">
      <span id="btSpent">$0</span> <span class="bt-of">of $2,400</span>
    </div>
  </div>

  <div class="bt-overall">
    <div class="bt-overall-track"><div class="bt-overall-fill" id="btOverallFill"></div></div>
    <span class="bt-overall-label" id="btOverallLabel"></span>
  </div>

  <div class="bt-cats" id="btCats"></div>
</div>*{box-sizing:border-box;margin:0;padding:0}
body{font-family:system-ui,-apple-system,sans-serif;background:#f1f5f9;min-height:100vh;display:flex;align-items:center;justify-content:center;padding:24px}
.bt-card{background:#fff;border-radius:18px;padding:22px;width:100%;max-width:420px;box-shadow:0 18px 44px rgba(15,23,42,.1)}
.bt-head{display:flex;align-items:flex-start;justify-content:space-between;margin-bottom:14px}
.bt-head h3{font-size:16px;font-weight:800;color:#0f172a}
.bt-head p{font-size:12px;color:#94a3b8;margin-top:2px}
.bt-total{text-align:right}
.bt-total span{font-size:18px;font-weight:800;color:#0f172a;font-variant-numeric:tabular-nums}
.bt-of{font-size:12px;font-weight:600;color:#94a3b8}
.bt-overall{margin-bottom:18px}
.bt-overall-track{height:9px;background:#f1f5f9;border-radius:999px;overflow:hidden}
.bt-overall-fill{height:100%;width:0;border-radius:999px;background:linear-gradient(90deg,#6366f1,#8b5cf6);transition:width .6s cubic-bezier(.4,0,.2,1)}
.bt-overall-fill.warn{background:linear-gradient(90deg,#f59e0b,#f97316)}
.bt-overall-fill.over{background:linear-gradient(90deg,#ef4444,#dc2626)}
.bt-overall-label{display:block;margin-top:6px;font-size:11.5px;font-weight:600;color:#64748b}
.bt-cats{display:flex;flex-direction:column;gap:13px}
.bt-cat-row{display:flex;flex-direction:column;gap:5px}
.bt-cat-top{display:flex;align-items:center;justify-content:space-between;font-size:13px}
.bt-cat-name{display:flex;align-items:center;gap:7px;font-weight:700;color:#1e293b}
.bt-cat-dot{width:8px;height:8px;border-radius:50%;flex-shrink:0}
.bt-cat-amt{font-weight:700;color:#475569;font-variant-numeric:tabular-nums;font-size:12.5px}
.bt-cat-amt .bt-cap{color:#cbd5e1;font-weight:600}
.bt-cat-track{height:6px;background:#f1f5f9;border-radius:999px;overflow:hidden}
.bt-cat-fill{height:100%;border-radius:999px;transition:width .6s cubic-bezier(.4,0,.2,1)}
.bt-cat-row.over .bt-cat-amt{color:#dc2626}var CATEGORIES = [
{ name: 'Groceries', color: '#22c55e', spent: 380, cap: 500 },
{ name: 'Dining out', color: '#f59e0b', spent: 265, cap: 250 },
{ name: 'Transport', color: '#6366f1', spent: 140, cap: 300 },
{ name: 'Entertainment', color: '#ec4899', spent: 95, cap: 150 },
{ name: 'Shopping', color: '#0ea5e9', spent: 410, cap: 400 },
];
var BUDGET_CAP = 2400;
function render() {
var totalSpent = CATEGORIES.reduce(function (s, c) { return s + c.spent; }, 0);
document.getElementById('btSpent').textContent = '$' + totalSpent.toLocaleString();
var pct = Math.min(100, (totalSpent / BUDGET_CAP) * 100);
var overallFill = document.getElementById('btOverallFill');
overallFill.style.width = pct + '%';
overallFill.className = 'bt-overall-fill' + (totalSpent > BUDGET_CAP ? ' over' : pct > 80 ? ' warn' : '');
var remaining = BUDGET_CAP - totalSpent;
document.getElementById('btOverallLabel').textContent = remaining >= 0
? '$' + remaining.toLocaleString() + ' left this month (' + Math.round(pct) + '% used)'
: '$' + Math.abs(remaining).toLocaleString() + ' over budget';
var cats = document.getElementById('btCats');
cats.innerHTML = CATEGORIES.map(function (c) {
var catPct = Math.min(100, (c.spent / c.cap) * 100);
var over = c.spent > c.cap;
return '<div class="bt-cat-row' + (over ? ' over' : '') + '">' +
'<div class="bt-cat-top">' +
'<span class="bt-cat-name"><i class="bt-cat-dot" style="background:' + c.color + '"></i>' + c.name + '</span>' +
'<span class="bt-cat-amt">$' + c.spent + ' <span class="bt-cap">/ $' + c.cap + '</span></span>' +
'</div>' +
'<div class="bt-cat-track"><div class="bt-cat-fill" style="width:' + catPct + '%;background:' + (over ? '#ef4444' : c.color) + '"></div></div>' +
'</div>';
}).join('');
}
render();Extend with AI
Take This Snippet Further With AI
The AI prompt for this one is for Patreon supporters ($3 a month), along with a site with no ads. Supporters enter the passcode once and it is remembered in this browser.
What's included
Features
About this UI Snippet
Budget Tracker Card — Overall Progress, Per-Category Caps & Over-Budget Warnings
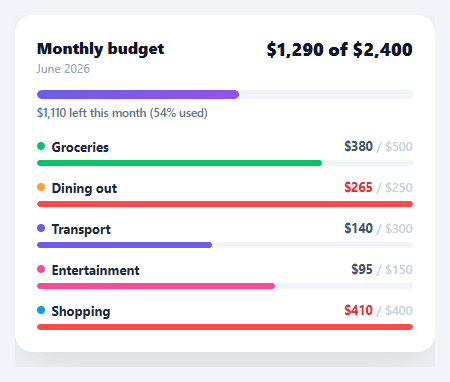
A budget tracker only earns trust if it's honest about overspending — a green bar that quietly turns red is far more useful than a generic progress indicator. This snippet builds a monthly budget card with an overall spend bar that shifts from indigo to amber to red as it fills, plus a per-category breakdown that flags any category individually over its own cap, all driven by one small data array.
One data array drives everything
CATEGORIES is a plain array of { name, color, spent, cap } objects, and BUDGET_CAP is the single overall monthly limit. render() sums every category's spent for the total, computes the overall percentage against BUDGET_CAP, and rebuilds the category list — so updating a single number anywhere in the data instantly recomputes the whole card with one function call, no manual DOM bookkeeping per field.
Three-state overall bar
The top progress bar's fill width is the spend percentage capped at 100% (so an over-budget month doesn't overflow the track), and its color escalates through three CSS classes: the default indigo-to-purple gradient under 80% used, an amber-to-orange .warn gradient from 80–100%, and a red .over gradient once total spend exceeds the cap. The label beneath switches wording too — "$X left this month" while under budget, "$X over budget" once it isn't — so the message matches the math instead of always reading as a vague percentage.
Per-category caps, independent of the overall total
Each category has its own cap, and a category can go over its own cap (shown in red, with the row's amount text turning red via an .over class) even while the *overall* budget is still healthy — exactly how real budgeting works: groceries can run over while the month as a whole is fine because other categories came in under. This nuance is what makes a per-category breakdown more useful than a single combined bar.
Smooth, export-safe fills
Every bar fill transitions only its width with a cubic-bezier ease — width transitions on a fixed-height track are stable in every export target because the track's own dimensions never change, only the inner fill's width, so there's no layout-shift risk the way animating a container's height would have.
Connecting real transaction data
The numbers here are static placeholders meant to demonstrate the visual states; a production budget tracker sums real transactions grouped by category, typically from a bank-linking API (Plaid and similar providers) or a manually logged expense table. Because every visual — bar width, color, and label wording — is recomputed from CATEGORIES and BUDGET_CAP inside a single render() call, swapping the data source is a one-line change: replace the static spent values with a sum of that period's transactions per category, call render() again, and the card's entire visual state (including which categories flip to the over-budget red) updates correctly with no other code to touch.
Step by step
How to Use
- 1Paste HTML, CSS, and JSA budget card renders with an overall progress bar and five category rows (Groceries, Dining, Transport, Entertainment, Shopping).
- 2Read the overall barIts color and the label beneath show whether you're under budget, in the 80%+ warning zone, or over for the month.
- 3Check each categoryCategories over their own cap show in red even if the overall budget is still healthy — read each row independently.
- 4Edit the dataChange any spent or cap value in the CATEGORIES array, or BUDGET_CAP, and call render() to see every bar and label recompute.
- 5Add or remove categoriesPush or remove an object in CATEGORIES — the category list and overall total both adjust automatically.
- 6Connect real transaction dataReplace the static spent values with a sum of your transaction API's amounts grouped by category, then call render() after each fetch.
Real-world uses
Common Use Cases
Got questions?
Frequently Asked Questions
Fetch your transactions, group and sum them by category into the same { name, color, spent, cap } shape used by CATEGORIES, assign the result to CATEGORIES, and call render() — every bar, label, and color recomputes from the new totals.
Edit the thresholds in render(): the ".warn" class is added when pct > 80, and ".over" when totalSpent > BUDGET_CAP — change 80 to whatever warning threshold fits your use case.
Add an input bound to BUDGET_CAP (or each category's cap) and call render() on change — the existing percentage math and color thresholds will reflect the new limit immediately.
The card has no built-in time period logic — it just compares spent against cap. Swap BUDGET_CAP and the category caps for your daily/weekly limits, and update the header text ("June 2026") to match your period.
In React, keep categories and budgetCap in state and compute percentages with useMemo, rendering rows with .map(); in Vue, use a computed categories array with v-for; in Angular, use *ngFor with a getter for percentages. The color-threshold logic ports directly into each framework's conditional class binding.