


Chord Diagram Chart — Free HTML CSS JS Snippet
Chord Diagram Chart · Charts · Plain HTML, CSS & JS · Live preview
Copy & paste
Source Code
<div class="app">
  <div class="card">
    <div class="card-header">
      <h3>Cross-Team Handoffs</h3>
      <p class="sub">Ribbon thickness shows how many items moved between two teams. Hover an arc to isolate its ribbons.</p>
    </div>
    <div class="chart-wrap">
      <svg id="chord" viewBox="0 0 480 480" xmlns="http://www.w3.org/2000/svg"></svg>
    </div>
    <div class="legend" id="legend"></div>
  </div>
</div>
* { margin: 0; padding: 0; box-sizing: border-box; }
body { background: #f8fafc; font-family: system-ui, sans-serif; min-height: 100vh; display: flex; align-items: center; justify-content: center; padding: 20px; }
.app { width: 100%; max-width: 500px; }
.card { background: #fff; border: 1px solid #e2e8f0; border-radius: 16px; padding: 22px; box-shadow: 0 12px 30px rgba(30,41,59,0.06); }
.card-header { margin-bottom: 8px; }
h3 { font-size: 16px; font-weight: 800; color: #1e293b; }
.sub { font-size: 12px; color: #94a3b8; margin-top: 3px; }
#chord { width: 100%; display: block; }
.chord-arc { cursor: pointer; transition: opacity 0.15s; }
.chord-ribbon { transition: opacity 0.2s; cursor: default; }
.chord-ribbon.dim { opacity: 0.06; }
.chord-ribbon.active { opacity: 0.85; }
.arc-label { font-size: 11px; font-weight: 700; fill: #334155; }
.legend { display: flex; flex-wrap: wrap; gap: 8px 14px; margin-top: 12px; }
.legend-item { display: flex; align-items: center; gap: 6px; font-size: 11.5px; font-weight: 600; color: #475569; }
.legend-item .sw { width: 10px; height: 10px; border-radius: 3px; flex-shrink: 0; }const svg = document.getElementById('chord');
const legendEl = document.getElementById('legend');
const NS = 'http://www.w3.org/2000/svg';
const NAMES = ['Design', 'Frontend', 'Backend', 'QA', 'Product'];
const COLORS = ['#6366f1', '#f97316', '#22c55e', '#e11d48', '#0ea5e9'];
// matrix[i][j] = items handed off from group i to group j
const matrix = [
[0, 32, 4, 2, 10],
[6, 0, 24, 14, 3],
[2, 10, 0, 28, 4],
[1, 6, 12, 0, 8],
[18, 4, 2, 3, 0],
];
const N = NAMES.length;
const CX = 240, CY = 240, R_OUTER = 190, R_INNER = 176, GAP = 0.035;
function el(tag, attrs) {
const e = document.createElementNS(NS, tag);
Object.entries(attrs).forEach(([k, v]) => e.setAttribute(k, v));
return e;
}
function polar(cx, cy, r, angle) {
return { x: cx + r * Math.cos(angle), y: cy + r * Math.sin(angle) };
}
function arcPath(cx, cy, r, a0, a1) {
const p0 = polar(cx, cy, r, a0);
const p1 = polar(cx, cy, r, a1);
const large = (a1 - a0) > Math.PI ? 1 : 0;
return `M ${p0.x} ${p0.y} A ${r} ${r} 0 ${large} 1 ${p1.x} ${p1.y}`;
}
function build() {
svg.innerHTML = '';
const rowTotals = matrix.map(row => row.reduce((a, b) => a + b, 0));
const colTotals = matrix[0].map((_, j) => matrix.reduce((sum, row) => sum + row[j], 0));
const groupTotals = rowTotals.map((r, i) => r + colTotals[i]);
const grandTotal = groupTotals.reduce((a, b) => a + b, 0);
const totalGap = GAP * N;
const usable = 2 * Math.PI - totalGap * 2 * Math.PI;
let cursor = -Math.PI / 2;
const groupAngles = [];
groupTotals.forEach((total, i) => {
const span = (total / grandTotal) * usable;
groupAngles.push({ start: cursor, end: cursor + span, total });
cursor += span + GAP * 2 * Math.PI;
});
// sub-segments within each arc: outgoing first, then incoming, proportional to flow amounts
const subSegments = groupAngles.map((ga, i) => {
const segs = [];
let sc = ga.start;
const span = ga.end - ga.start;
for (let j = 0; j < N; j++) {
const val = matrix[i][j];
if (val <= 0) continue;
const w = (val / ga.total) * span;
segs.push({ to: j, from: i, start: sc, end: sc + w, val });
sc += w;
}
for (let j = 0; j < N; j++) {
if (j === i) continue;
const val = matrix[j][i];
if (val <= 0) continue;
const w = (val / ga.total) * span;
segs.push({ to: i, from: j, start: sc, end: sc + w, val, incoming: true });
sc += w;
}
return segs;
});
// draw group arcs
groupAngles.forEach((ga, i) => {
const path = el('path', {
class: 'chord-arc',
d: arcPath(CX, CY, R_OUTER, ga.start, ga.end),
fill: 'none', stroke: COLORS[i], 'stroke-width': R_OUTER - R_INNER,
'data-idx': i,
});
svg.appendChild(path);
const mid = (ga.start + ga.end) / 2;
const lp = polar(CX, CY, R_OUTER + 16, mid);
const label = el('text', {
class: 'arc-label', x: lp.x, y: lp.y,
'text-anchor': mid > Math.PI / 2 && mid < 3 * Math.PI / 2 ? 'end' : 'start',
});
label.textContent = NAMES[i];
svg.appendChild(label);
path.addEventListener('mouseenter', () => setActive(i));
path.addEventListener('mouseleave', () => setActive(null));
});
// draw ribbons: one per unordered pair with flow in either direction
const ribbons = [];
for (let i = 0; i < N; i++) {
for (let j = i + 1; j < N; j++) {
const vIJ = matrix[i][j];
const vJI = matrix[j][i];
if (vIJ <= 0 && vJI <= 0) continue;
const segI = subSegments[i].find(s => s.to === j && s.from === i);
const segJfromI = subSegments[j].find(s => s.to === j && s.from === i && s.incoming);
const segJ = subSegments[j].find(s => s.to === i && s.from === j);
const segIfromJ = subSegments[i].find(s => s.to === i && s.from === j && s.incoming);
const aStart = segI ? segI.start : segIfromJ.start;
const aEnd = segI ? segI.end : segIfromJ.end;
const bStart = segJ ? segJ.start : segJfromI.start;
const bEnd = segJ ? segJ.end : segJfromI.end;
const p1 = polar(CX, CY, R_INNER, aStart);
const p2 = polar(CX, CY, R_INNER, aEnd);
const p3 = polar(CX, CY, R_INNER, bStart);
const p4 = polar(CX, CY, R_INNER, bEnd);
const d = `M ${p1.x} ${p1.y} A ${R_INNER} ${R_INNER} 0 0 1 ${p2.x} ${p2.y} Q ${CX} ${CY} ${p3.x} ${p3.y} A ${R_INNER} ${R_INNER} 0 0 1 ${p4.x} ${p4.y} Q ${CX} ${CY} ${p1.x} ${p1.y} Z`;
const ribbon = el('path', {
class: 'chord-ribbon', d,
fill: COLORS[vIJ >= vJI ? i : j], 'fill-opacity': '0.42',
stroke: COLORS[vIJ >= vJI ? i : j], 'stroke-width': '0.5',
'data-a': i, 'data-b': j,
});
const title = el('title', {});
title.textContent = `${NAMES[i]} \u2194 ${NAMES[j]}: ${vIJ} + ${vJI} handoffs`;
ribbon.appendChild(title);
svg.appendChild(ribbon);
ribbons.push(ribbon);
}
}
function setActive(idx) {
ribbons.forEach(r => {
if (idx === null) { r.classList.remove('dim', 'active'); return; }
const a = Number(r.dataset.a), b = Number(r.dataset.b);
const involved = a === idx || b === idx;
r.classList.toggle('active', involved);
r.classList.toggle('dim', !involved);
});
}
legendEl.innerHTML = '';
NAMES.forEach((name, i) => {
const item = document.createElement('div');
item.className = 'legend-item';
const sw = document.createElement('span');
sw.className = 'sw';
sw.style.background = COLORS[i];
item.appendChild(sw);
item.appendChild(document.createTextNode(name));
item.addEventListener('mouseenter', () => setActive(i));
item.addEventListener('mouseleave', () => setActive(null));
legendEl.appendChild(item);
});
}
build();Extend with AI
Take This Snippet Further With AI
The AI prompt for this one is for Patreon supporters ($3 a month, 7 days free), along with a site with no ads. Supporters enter the passcode once and it is remembered in this browser.
What's included
Features
About this UI Snippet
Chord Diagram Chart — Circular Flow Visualization Built from an Adjacency Matrix
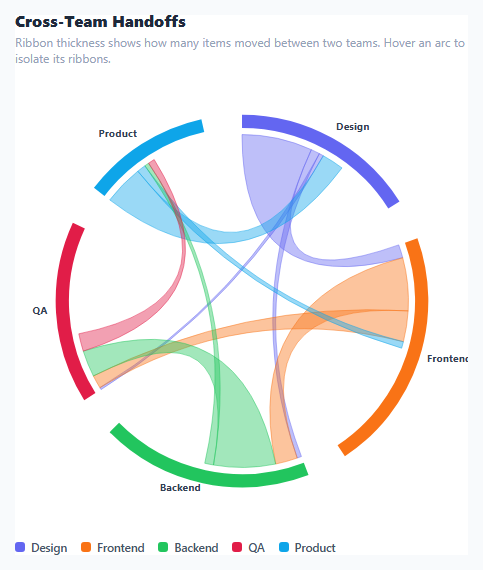
A chord diagram arranges categories as arcs around a circle and draws a ribbon between every pair with a nonzero flow, where each ribbon's width represents the size of that flow. It is the standard way to visualize relationships or transfers between many entities at once — who sends what to whom — when a Sankey diagram's left-to-right layout doesn't fit because the flows are bidirectional or cyclic (any category can send to, and receive from, any other) rather than moving through discrete left-to-right stages.
Representing flows as an adjacency matrix
The data model is a square matrix where matrix[i][j] is the amount that flowed from group i to group j — here, work items handed off from one team to another. Unlike a Sankey diagram's stage-based node list, a matrix naturally allows matrix[i][j] and matrix[j][i] to both be nonzero and different (Frontend hands off 24 items to Backend, while Backend hands back only 10 in the other direction), which is exactly the kind of bidirectional relationship a chord diagram is built to show that a strictly directional layout cannot.
Sizing each group's arc proportionally to its total involvement
Each group's outer arc length is proportional to its groupTotals[i] — the sum of everything it sent out (rowTotals[i]) plus everything it received (colTotals[i]) — divided by the grandTotal across all groups, scaled to fill 2π radians minus small fixed gaps between arcs. A group involved in a lot of handoffs, in either direction, gets a visually larger arc than one with only a little total flow, giving an immediate at-a-glance sense of which categories are the busiest hubs.
Sub-dividing each arc into per-connection segments
Within a single group's arc span, the code further divides it into subSegments — one smaller segment per other group it exchanges with, sized proportionally to that specific flow amount relative to the group's own total. Outgoing flows are placed first around the arc, followed by incoming flows, so each group's arc reads, walking around it, as "here's how each of my outgoing flows breaks down, then here's how each of my incoming flows breaks down." These segment boundaries are exactly where each connecting ribbon attaches to the arc.
Drawing a ribbon between two arcs
For every unordered pair of groups with any nonzero flow in either direction, one ribbon is drawn as a single closed SVG path: two arcs along the inner radius (each following that pair's matching sub-segment boundaries computed above) connected by two quadratic Bézier curves (Q commands) that bow through the circle's center point. This is the classic chord-diagram ribbon shape — a band that appears to twist from one arc's edge to the other's, with its width at each end reflecting the actual flow size in that direction. The ribbon's fill color is taken from whichever of the two groups sent the larger amount, so at a glance the color hints at which direction dominates that pairwise relationship.
Hover-to-isolate interaction
Because a busy chord diagram can have many overlapping ribbons, hovering any arc or its matching legend entry calls setActive(idx), which checks every ribbon's stored data-a/data-b group indices and dims (opacity near zero) every ribbon not touching the hovered group while boosting the opacity of every ribbon that does — instantly isolating one category's full set of relationships out of an otherwise dense tangle of bands.
Step by step
How to Use
- 1Read the outer arcsEach colored arc is one category; its length is proportional to that category's total flow, both sent and received, relative to the whole dataset.
- 2Read the ribbonsEach band connecting two arcs represents the flow between that pair; its width at each end shows how much moved in each direction, and its color reflects whichever side sent more.
- 3Hover an arc or legend entry to isolate itsetActive(idx) dims every ribbon that does not touch the hovered category, letting you trace one category's full set of relationships instantly.
- 4Check exact numbersHover any ribbon directly to see a native tooltip with the exact combined handoff count between that pair of categories.
- 5Edit the dataUpdate the NAMES array and the matrix of flow values — matrix[i][j] is the amount flowing from group i to group j, and can differ from matrix[j][i].
- 6Add more categoriesAdd an entry to NAMES and COLORS, and a corresponding new row plus a new column entry in every existing row of matrix. The layout code automatically adapts to however many groups exist.
Real-world uses
Common Use Cases
Got questions?
Frequently Asked Questions
A Sankey diagram arranges nodes in ordered left-to-right stages and flows move strictly forward between them. A chord diagram arranges all categories around a single circle instead, which naturally supports bidirectional or cyclic relationships — any category can both send to and receive from any other category, shown as one ribbon with potentially different widths on each end.
Each group's arc length is proportional to groupTotals[i], the sum of everything that group sent out (its row total) plus everything it received (its column total), divided by the grand total across all groups and all flows, then scaled to fill the full circle minus small fixed gaps between arcs.
Each ribbon is one closed SVG path: an arc along the inner radius at one group's sub-segment boundary, a quadratic Bézier curve (Q command) bowing through the circle's exact center to the other group's matching sub-segment boundary, another inner-radius arc there, and a second Bézier curve back through the center to close the shape.
The ribbon fill uses whichever group sent the larger amount in that pairwise relationship (matrix[i][j] versus matrix[j][i]), giving a quick color-based hint about which direction of the relationship dominates without needing a separate directional indicator like an arrowhead.
Yes — that is the normal case. matrix[i][j] and matrix[j][i] are independent values, so a ribbon can be visibly wider at one end than the other, directly showing an imbalanced relationship (for example, one team sending far more handoffs than it receives back from the same team).
Yes. Use the JSX, Vue, Angular, or Tailwind export buttons on this page. In React, recompute the group angles, sub-segments, and ribbon paths from your matrix data during render (memoizing with useMemo since the layout math runs over every pair of groups) and manage the hovered index in state instead of toggling classList directly.