

Interact.js Draggable and Resizable Dashboard Panels with Snapping
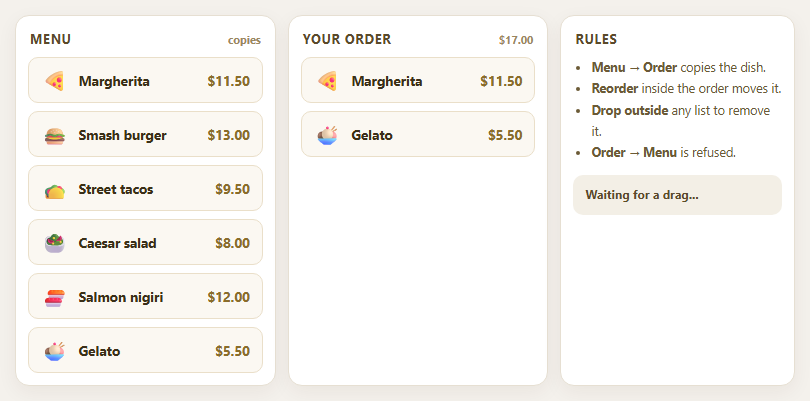
Dragula Copy vs Move Lists with Spill Control

SortableJS Shared Groups: Clone from a Palette into a Page Builder

SortableJS Drag Handle with Pinned and Locked Rows
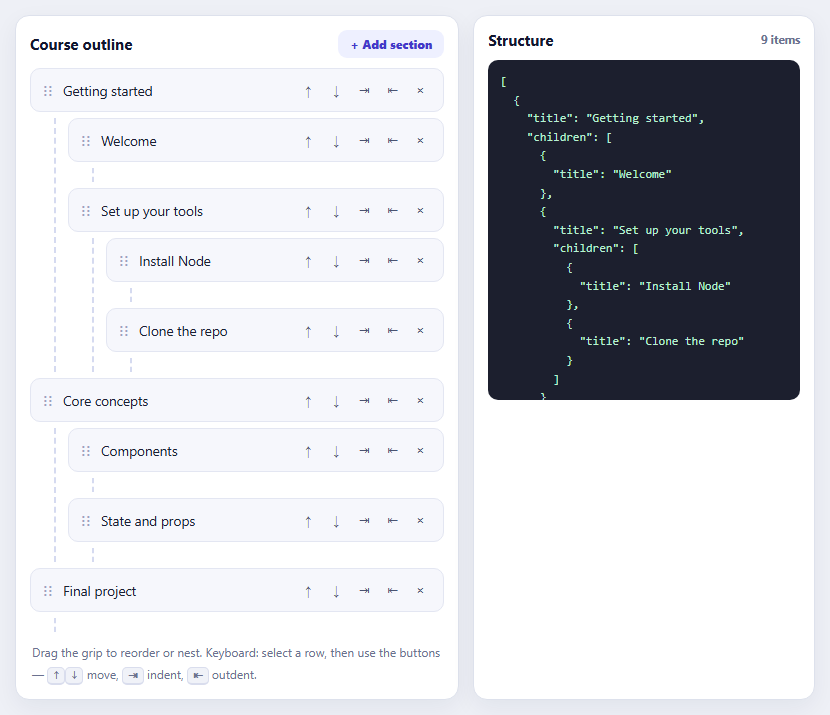
SortableJS Nested Sortable Tree with Keyboard Controls
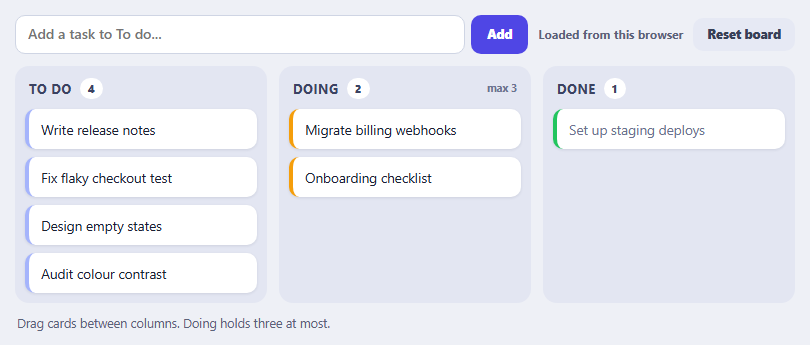
SortableJS Multi-List Kanban with Persistence and WIP Limit
Uptime Status Page — Service History Bars HTML CSS
Uptime Status Page · Dashboards · Plain HTML, CSS & JS · Live preview
Copy & paste
Source Code
<div class="usp-card">
  <div class="usp-head">
    <div class="usp-overall" id="uspOverall">
      <span class="usp-overall-dot"></span>
      <span id="uspOverallText">All systems operational</span>
    </div>
    <span class="usp-updated">Updated just now</span>
  </div>

  <div class="usp-services" id="uspServices"></div>
</div>*{box-sizing:border-box;margin:0;padding:0}
body{font-family:system-ui,-apple-system,sans-serif;background:#f1f5f9;min-height:100vh;display:flex;align-items:center;justify-content:center;padding:24px}
.usp-card{background:#fff;border-radius:16px;padding:20px;width:100%;max-width:560px;box-shadow:0 18px 44px rgba(15,23,42,.1)}
.usp-head{display:flex;align-items:center;justify-content:space-between;padding-bottom:14px;border-bottom:1px solid #f1f5f9;margin-bottom:14px}
.usp-overall{display:flex;align-items:center;gap:8px;font-size:14.5px;font-weight:800;color:#0f172a}
.usp-overall-dot{width:9px;height:9px;border-radius:50%;background:#22c55e}
.usp-overall.degraded .usp-overall-dot{background:#f59e0b}
.usp-overall.outage .usp-overall-dot{background:#ef4444}
.usp-updated{font-size:11.5px;color:#94a3b8;font-weight:600}
.usp-service{padding:13px 0;border-bottom:1px solid #f8fafc}
.usp-service:last-child{border-bottom:none}
.usp-row{display:flex;align-items:center;justify-content:space-between;margin-bottom:9px}
.usp-name{display:flex;align-items:center;gap:9px;font-size:13.5px;font-weight:700;color:#1e293b}
.usp-status-dot{width:8px;height:8px;border-radius:50%;flex-shrink:0}
.usp-status-dot.operational{background:#22c55e}
.usp-status-dot.degraded{background:#f59e0b}
.usp-status-dot.outage{background:#ef4444}
.usp-status-label{font-size:11.5px;font-weight:700}
.usp-status-label.operational{color:#16a34a}
.usp-status-label.degraded{color:#d97706}
.usp-status-label.outage{color:#dc2626}
.usp-bars{display:flex;gap:2px;align-items:flex-end;height:26px}
.usp-bar{flex:1;border-radius:2px;min-height:4px;background:#22c55e;cursor:pointer;position:relative}
.usp-bar.degraded{background:#f59e0b}
.usp-bar.outage{background:#ef4444}
.usp-bar:hover::after{content:attr(data-tip);position:absolute;bottom:calc(100% + 6px);left:50%;transform:translateX(-50%);
background:#1e293b;color:#fff;font-size:10.5px;font-weight:600;padding:4px 7px;border-radius:5px;white-space:nowrap;z-index:5}
.usp-uptime{display:flex;justify-content:space-between;margin-top:5px;font-size:10.5px;color:#cbd5e1;font-weight:600}var SERVICES = [
{ name: 'API', status: 'operational' },
{ name: 'Web App', status: 'operational' },
{ name: 'Database', status: 'degraded' },
{ name: 'Webhooks', status: 'operational' },
{ name: 'Email delivery', status: 'outage' },
];
var DAYS = 90;
function genHistory(currentStatus) {
var bars = [];
for (var i = 0; i < DAYS; i++) {
var isToday = i === DAYS - 1;
var r = Math.random();
var status = isToday ? currentStatus : (r > 0.985 ? 'outage' : r > 0.95 ? 'degraded' : 'operational');
bars.push(status);
}
return bars;
}
function uptimePct(bars) {
var healthy = bars.filter(function (s) { return s === 'operational'; }).length;
return ((healthy / bars.length) * 100).toFixed(2);
}
function labelFor(status) {
return { operational: 'Operational', degraded: 'Degraded performance', outage: 'Major outage' }[status];
}
function buildServices() {
var html = SERVICES.map(function (svc, si) {
var history = genHistory(svc.status);
var pct = uptimePct(history);
var bars = history.map(function (s, i) {
var daysAgo = DAYS - 1 - i;
var tip = (daysAgo === 0 ? 'Today' : daysAgo + 'd ago') + ' · ' + labelFor(s);
return '<div class="usp-bar ' + (s === 'operational' ? '' : s) + '" data-tip="' + tip + '"></div>';
}).join('');
return '<div class="usp-service" data-i="' + si + '">' +
'<div class="usp-row">' +
'<span class="usp-name"><i class="usp-status-dot ' + svc.status + '"></i>' + svc.name + '</span>' +
'<span class="usp-status-label ' + svc.status + '">' + labelFor(svc.status) + '</span>' +
'</div>' +
'<div class="usp-bars">' + bars + '</div>' +
'<div class="usp-uptime"><span>' + DAYS + ' days ago</span><span>' + pct + '% uptime</span><span>Today</span></div>' +
'</div>';
}).join('');
document.getElementById('uspServices').innerHTML = html;
updateOverall();
}
function updateOverall() {
var worst = SERVICES.reduce(function (acc, s) {
var rank = { operational: 0, degraded: 1, outage: 2 };
return rank[s.status] > rank[acc] ? s.status : acc;
}, 'operational');
var box = document.getElementById('uspOverall');
box.className = 'usp-overall' + (worst === 'operational' ? '' : ' ' + worst);
document.getElementById('uspOverallText').textContent = worst === 'operational'
? 'All systems operational'
: worst === 'degraded'
? 'Some systems experiencing degraded performance'
: 'Major outage affecting one or more systems';
}
buildServices();Extend with AI
Take This Snippet Further With AI
The AI prompt for this one is for Patreon supporters ($3 a month, 7 days free), along with a site with no ads. Supporters enter the passcode once and it is remembered in this browser.
What's included
Features
About this UI Snippet
Uptime Status Page — 90-Day History Bars, Hover Tooltips & Aggregated Status

A public status page exists to answer one question fast — "is it just me, or is the whole service down?" — and the format every major status page (Statuspage, Better Uptime, Cachet) converges on is the same: a banner summarizing overall health, and a row of tiny colored bars per service showing recent history at a glance. This snippet builds that exact pattern in plain HTML, CSS, and vanilla JavaScript.
History bars as data, not images
Each service renders 90 thin <div> bars in a flex row, one per day, colored green/amber/red for operational/degraded/outage. genHistory() generates a randomized history that's mostly green with rare amber and red days, and the *last* bar always reflects the service's actual current status — so the simulated history stays consistent with the live status shown in the row above it. Replace genHistory() with real incident data and the rendering needs no changes.
Hover tooltips without a tooltip library
Each bar carries its day-relative label and status in a data-tip attribute, and a pure-CSS ::after pseudo-element reads it via content: attr(data-tip) on hover — no JavaScript positioning logic and no extra DOM nodes per bar, which matters here since there are 90 bars × however many services. This is the same zero-JS tooltip technique used for lightweight hint text throughout this library.
Uptime percentage, computed from the bars themselves
uptimePct() doesn't take a separate "99.9% uptime" number from anywhere — it counts how many of the 90 generated bars are operational and divides by the total. This guarantees the displayed percentage and the visual bar row can never contradict each other, which is a real bug class in hand-maintained status pages where the number and the history graphic are updated separately and drift apart.
Aggregated overall status
The top banner doesn't just say "operational" by default — updateOverall() reduces every service's status to find the *worst* one present (outage beats degraded beats operational) and reflects that exact severity in both the banner's color and its message. A single degraded service is enough to turn the whole banner amber; a single outage turns it red — exactly how users expect "is everything okay?" to be answered.
Why a status page exists separately from internal monitoring
Internal dashboards (Grafana, Datadog) are built for engineers diagnosing a problem; a public status page is built for everyone else asking one question fast. Keeping it as its own simple, low-dependency page — rather than exposing the internal monitoring tool directly — also means it can stay up and informative even during an incident that's affecting other parts of the infrastructure, which is exactly the moment a status page matters most.
Step by step
How to Use
- 1Paste HTML, CSS, and JSA status page renders with an overall banner and five services, each with a row of 90 colored history bars.
- 2Read the overall bannerIts color and message reflect the single worst status across every service — amber for any degraded service, red for any outage.
- 3Hover a history barA tooltip shows that day's relative date and status (e.g. "12d ago · Operational") without any extra markup per bar.
- 4Check the uptime percentageEach service's footer shows a percentage computed directly from its own visible 90-day bar history.
- 5Edit the servicesChange any entry's name or status in SERVICES, then call buildServices() to regenerate the whole page including the overall banner.
- 6Connect real incident dataReplace genHistory()'s random generator with your actual per-day status history fetched from an incident/monitoring API.
Real-world uses
Common Use Cases
Got questions?
Frequently Asked Questions
Replace genHistory()'s random-status loop with a fetch to your monitoring or incident-management API, mapping each returned day to 'operational', 'degraded', or 'outage'; keep the same array shape so buildServices() and uptimePct() need no other changes.
For days with a 'degraded' or 'outage' status, attach an incident summary string and render a list of those summaries (with dates) beneath the bar row or in a separate "Past incidents" section, linking each entry back to the relevant day.
Change the DAYS constant — genHistory(), the bar rendering, and uptimePct() all derive their loop length and percentage calculation from that single value.
Wrap a fetch-and-rebuild call in setInterval (e.g. every 60 seconds), updating each service's live status from your API before calling buildServices() again, and update the "Updated just now" label with the current timestamp.
In React, keep services in state and derive history/uptime with useMemo per service, rendering bars with .map(); in Vue, use a computed services array with nested v-for; in Angular, use *ngFor with a pipe for the uptime percentage. The worst-status reduction for the overall banner ports directly into each framework.