
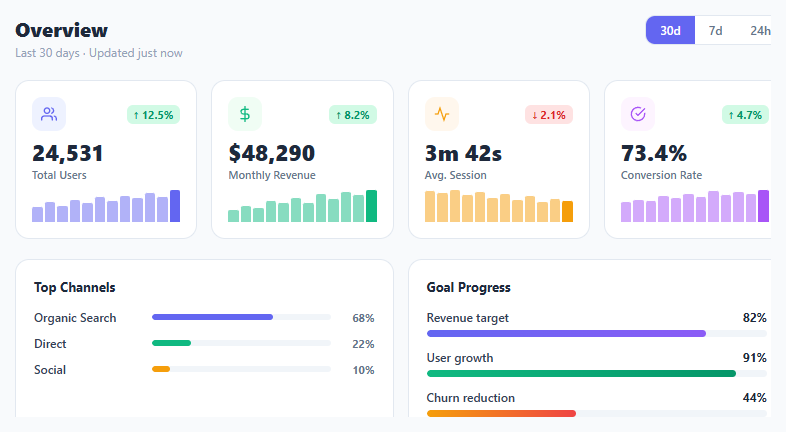
Metric KPI Card Grid

Interact.js Draggable and Resizable Dashboard Panels with Snapping
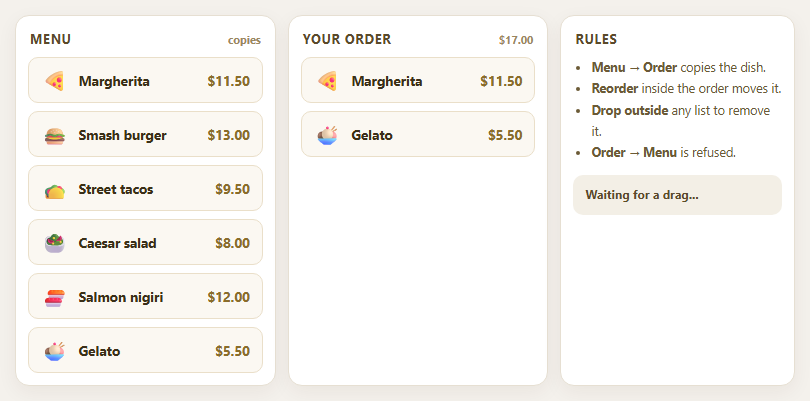
Dragula Copy vs Move Lists with Spill Control

SortableJS Shared Groups: Clone from a Palette into a Page Builder

SortableJS Drag Handle with Pinned and Locked Rows
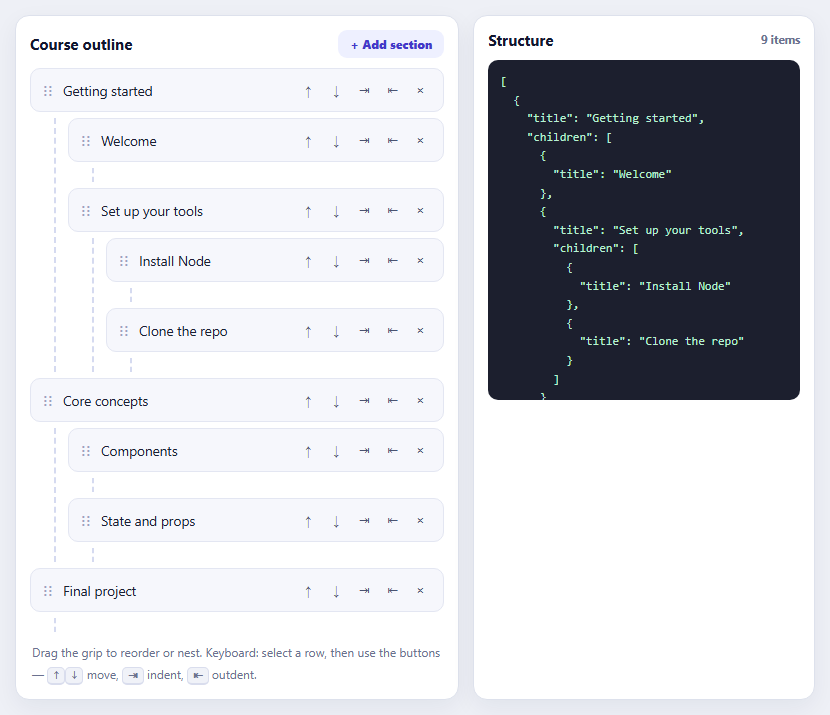
SortableJS Nested Sortable Tree with Keyboard Controls
Weather Widget Card — Free HTML CSS Snippet
Weather Widget · Dashboards · Plain HTML & CSS · Live preview
Copy & paste
Source Code
<div class="wrap">
<div class="card">
<div class="top">
<div class="left">
<div class="city">San Francisco</div>
<div class="country">California, US</div>
<div class="temp-row">
<span class="temp">18</span>
<span class="unit">°C</span>
</div>
<div class="condition">Partly Cloudy</div>
<div class="feels">Feels like 16°C</div>
</div>
<div class="right">
<svg class="weather-icon" viewBox="0 0 120 80" fill="none" xmlns="http://www.w3.org/2000/svg">
<circle cx="40" cy="38" r="20" fill="#fbbf24" opacity="0.9"/>
<ellipse cx="65" cy="52" rx="28" ry="18" fill="white" opacity="0.95"/>
<ellipse cx="48" cy="56" rx="22" ry="14" fill="white"/>
<ellipse cx="80" cy="58" rx="18" ry="12" fill="#e2e8f0"/>
</svg>
</div>
</div>
<div class="stats">
<div class="stat">
<svg width="16" height="16" viewBox="0 0 24 24" fill="none" stroke="currentColor" stroke-width="2"><path d="M12 2a10 10 0 1 0 0 20 10 10 0 0 0 0-20z"/><path d="M12 6v6l4 2"/></svg>
<div class="stat-label">Humidity</div>
<div class="stat-val">74%</div>
</div>
<div class="stat">
<svg width="16" height="16" viewBox="0 0 24 24" fill="none" stroke="currentColor" stroke-width="2"><path d="M9.59 4.59A2 2 0 1 1 11 8H2m10.59 11.41A2 2 0 1 0 14 16H2m15.73-8.27A2.5 2.5 0 1 1 19.5 12H2"/></svg>
<div class="stat-label">Wind</div>
<div class="stat-val">14 km/h</div>
</div>
<div class="stat">
<svg width="16" height="16" viewBox="0 0 24 24" fill="none" stroke="currentColor" stroke-width="2"><circle cx="12" cy="12" r="5"/><line x1="12" y1="1" x2="12" y2="3"/><line x1="12" y1="21" x2="12" y2="23"/><line x1="4.22" y1="4.22" x2="5.64" y2="5.64"/><line x1="18.36" y1="18.36" x2="19.78" y2="19.78"/><line x1="1" y1="12" x2="3" y2="12"/><line x1="21" y1="12" x2="23" y2="12"/><line x1="4.22" y1="19.78" x2="5.64" y2="18.36"/><line x1="18.36" y1="5.64" x2="19.78" y2="4.22"/></svg>
<div class="stat-label">UV Index</div>
<div class="stat-val">3 Low</div>
</div>
<div class="stat">
<svg width="16" height="16" viewBox="0 0 24 24" fill="none" stroke="currentColor" stroke-width="2"><path d="M14 14.76V3.5a2.5 2.5 0 0 0-5 0v11.26a4.5 4.5 0 1 0 5 0z"/></svg>
<div class="stat-label">Dew Point</div>
<div class="stat-val">13°C</div>
</div>
</div>
<div class="forecast">
<div class="fc-day">
<span class="fc-label">Mon</span>
<svg class="fc-icon" viewBox="0 0 40 28" fill="none"><circle cx="14" cy="13" r="7" fill="#fbbf24" opacity="0.9"/><ellipse cx="24" cy="18" rx="10" ry="7" fill="white"/></svg>
<span class="fc-hi">21°</span>
<span class="fc-lo">12°</span>
</div>
<div class="fc-day">
<span class="fc-label">Tue</span>
<svg class="fc-icon" viewBox="0 0 40 28" fill="none"><ellipse cx="20" cy="16" rx="14" ry="9" fill="#94a3b8"/><line x1="10" y1="22" x2="8" y2="28" stroke="#7dd3fc" stroke-width="2" stroke-linecap="round"/><line x1="16" y1="22" x2="14" y2="28" stroke="#7dd3fc" stroke-width="2" stroke-linecap="round"/><line x1="22" y1="22" x2="20" y2="28" stroke="#7dd3fc" stroke-width="2" stroke-linecap="round"/></svg>
<span class="fc-hi">15°</span>
<span class="fc-lo">9°</span>
</div>
<div class="fc-day">
<span class="fc-label">Wed</span>
<svg class="fc-icon" viewBox="0 0 40 28" fill="none"><ellipse cx="20" cy="16" rx="14" ry="9" fill="#64748b"/><line x1="10" y1="22" x2="8" y2="28" stroke="#7dd3fc" stroke-width="2" stroke-linecap="round"/><line x1="16" y1="22" x2="14" y2="28" stroke="#7dd3fc" stroke-width="2" stroke-linecap="round"/><line x1="22" y1="22" x2="20" y2="28" stroke="#7dd3fc" stroke-width="2" stroke-linecap="round"/><line x1="28" y1="22" x2="26" y2="28" stroke="#7dd3fc" stroke-width="2" stroke-linecap="round"/></svg>
<span class="fc-hi">13°</span>
<span class="fc-lo">8°</span>
</div>
<div class="fc-day">
<span class="fc-label">Thu</span>
<svg class="fc-icon" viewBox="0 0 40 28" fill="none"><circle cx="14" cy="13" r="7" fill="#fbbf24" opacity="0.7"/><ellipse cx="24" cy="18" rx="10" ry="7" fill="#e2e8f0"/></svg>
<span class="fc-hi">19°</span>
<span class="fc-lo">11°</span>
</div>
<div class="fc-day">
<span class="fc-label">Fri</span>
<svg class="fc-icon" viewBox="0 0 40 28" fill="none"><circle cx="20" cy="12" r="8" fill="#fbbf24" opacity="0.9"/></svg>
<span class="fc-hi">23°</span>
<span class="fc-lo">14°</span>
</div>
</div>
<div class="updated">Updated just now · Open-Meteo API</div>
</div>
</div>* { box-sizing: border-box; margin: 0; padding: 0; }
body { font-family: system-ui, sans-serif; background: linear-gradient(135deg, #0369a1 0%, #0ea5e9 50%, #38bdf8 100%); min-height: 100vh; display: flex; align-items: center; justify-content: center; padding: 20px; }
.wrap { width: 100%; max-width: 380px; }
.card { background: rgba(255,255,255,0.12); backdrop-filter: blur(20px); -webkit-backdrop-filter: blur(20px); border: 1px solid rgba(255,255,255,0.25); border-radius: 24px; padding: 24px; color: #fff; }
.top { display: flex; justify-content: space-between; align-items: flex-start; margin-bottom: 24px; }
.left { flex: 1; }
.city { font-size: 20px; font-weight: 800; }
.country { font-size: 12px; color: rgba(255,255,255,0.7); margin-bottom: 12px; }
.temp-row { display: flex; align-items: flex-start; line-height: 1; margin-bottom: 4px; }
.temp { font-size: 56px; font-weight: 900; line-height: 1; }
.unit { font-size: 24px; font-weight: 300; margin-top: 8px; color: rgba(255,255,255,0.8); }
.condition { font-size: 15px; font-weight: 600; color: rgba(255,255,255,0.9); margin-bottom: 2px; }
.feels { font-size: 12px; color: rgba(255,255,255,0.6); }
.right { flex-shrink: 0; }
.weather-icon { width: 110px; height: 74px; }
.stats { display: grid; grid-template-columns: 1fr 1fr; gap: 12px; margin-bottom: 24px; }
.stat { background: rgba(255,255,255,0.1); border-radius: 14px; padding: 12px 14px; }
.stat svg { color: rgba(255,255,255,0.7); margin-bottom: 6px; }
.stat-label { font-size: 11px; color: rgba(255,255,255,0.6); margin-bottom: 2px; }
.stat-val { font-size: 15px; font-weight: 700; }
.forecast { display: flex; gap: 8px; justify-content: space-between; margin-bottom: 16px; }
.fc-day { flex: 1; display: flex; flex-direction: column; align-items: center; gap: 4px; background: rgba(255,255,255,0.08); border-radius: 12px; padding: 10px 4px; }
.fc-label { font-size: 11px; color: rgba(255,255,255,0.6); font-weight: 600; }
.fc-icon { width: 36px; height: 26px; }
.fc-hi { font-size: 13px; font-weight: 700; }
.fc-lo { font-size: 11px; color: rgba(255,255,255,0.5); }
.updated { font-size: 10px; color: rgba(255,255,255,0.4); text-align: right; }Extend with AI
Take This Snippet Further With AI
The AI prompt for this one is for Patreon supporters ($3 a month), along with a site with no ads. Supporters enter the passcode once and it is remembered in this browser.
What's included
Features
About this UI Snippet
Weather Widget — Glassmorphism Card with Forecast Strip and Detail Stats
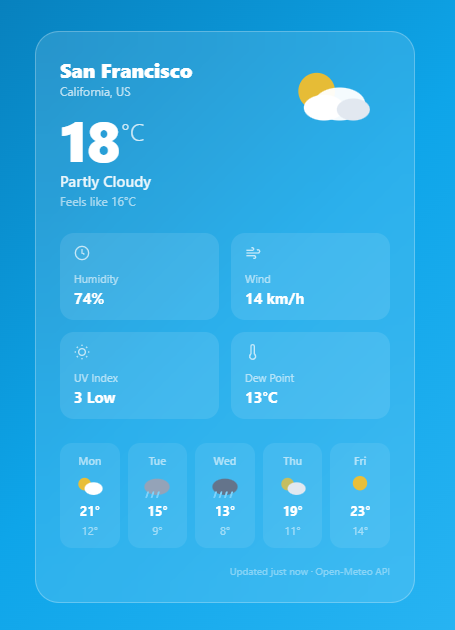
A weather widget is one of the most commonly requested UI cards for dashboards, landing pages, travel apps, and home screens. This snippet delivers a complete glassmorphism weather card with a large temperature display, partly-cloudy inline SVG weather icon, humidity/wind/UV/dew-point stat grid, a 5-day mini forecast strip with per-day SVG icons, and an "Updated just now" attribution footer.
The glassmorphism effect
The card uses the same glassmorphism recipe — background: rgba(255,255,255,0.12) with backdrop-filter: blur(20px) over a gradient background. backdrop-filter blurs whatever is behind the element, creating the frosted glass look. A semi-transparent white border (rgba(255,255,255,0.25)) adds a subtle edge highlight. This effect requires the body or a parent to have a visible background — in this case a blue gradient simulating a clear sky.
Inline SVG weather icons
All weather icons in the snippet are hand-crafted inline SVGs using primitive shapes — circles for the sun, ellipses for clouds, and short lines for rain drops. This avoids any icon library dependency. The forecast strip uses five different SVG variations: sunny, partly cloudy, light rain, heavy rain, and cloudy — built from the same circle/ellipse/line primitives.
The stat grid
Four weather detail stats (Humidity, Wind, UV Index, Dew Point) use a 2-column CSS Grid inside the card. Each .stat block has a lightly tinted glass background, a label, and a value. The SVG icons inside each block use currentColor — they inherit the white text color automatically.
Production API integration
The snippet uses static data for the demo. To wire it to live data, use the Open-Meteo API (free, no key required): fetch the /forecast endpoint with latitude, longitude, and current_weather=true parameters. The API returns temperature, windspeed, and a weathercode integer you can map to condition strings and SVG icons.
Geolocation for automatic local weather
To show the user's own local weather automatically, call navigator.geolocation.getCurrentPosition(pos => { const { latitude, longitude } = pos.coords; fetchWeather(latitude, longitude); }). On success, use the coordinates to call the Open-Meteo or OpenWeatherMap API. For a city name label, reverse geocode the coordinates using the Open-Meteo geocoding API or BigDataCloud's free reverse geocoding endpoint — both return a city name and country without an API key.
Celsius and Fahrenheit toggle
Store the raw Celsius value in a variable. A unit toggle button calls a convertTemp() function that either displays the raw value (°C) or applies Math.round(temp * 9/5 + 32) for °F. Toggle a data-unit attribute on the card container and update both the .temp element and all forecast high/low values in a single pass. The feels-like temperature uses the same formula. Store the unit preference in localStorage so the user's choice persists across page loads.
Step by step
How to Use
- 1Update the location and dataEdit the .city and .country text. Change the .temp number, .condition text, .feels text, and the four .stat-val values to match your target location.
- 2Update the 5-day forecastEdit each .fc-day block: change .fc-label (day name), .fc-hi and .fc-lo (high/low temps), and replace the .fc-icon SVG with the appropriate weather condition SVG.
- 3Fetch live data from Open-MeteoOpen-Meteo is free, no API key required. Call: fetch("https://api.open-meteo.com/v1/forecast?latitude=37.77&longitude=-122.42¤t_weather=true&daily=temperature_2m_max,temperature_2m_min,weathercode&timezone=auto"). Map the returned weathercode to condition labels and choose the matching SVG.
- 4Add a location searchAdd a search box and use the Open-Meteo geocoding API to convert city names to coordinates. On submit, call the forecast API with the returned latitude and longitude and update the card DOM.
- 5Export for your frameworkClick "JSX" for a React component that accepts a weather data prop object. Click "Vue" for a Vue 3 SFC. Click "Tailwind" for a React + Tailwind version.
Real-world uses
Common Use Cases
Got questions?
Frequently Asked Questions
Use Open-Meteo (free, no API key): fetch(https://api.open-meteo.com/v1/forecast?latitude=${lat}&longitude=${lon}¤t_weather=true&daily=temperature_2m_max,temperature_2m_min,weathercode&timezone=auto). The response includes current_weather.temperature, current_weather.weathercode, and daily arrays for the 7-day forecast. Map weathercode integers to condition labels and icon variants.
backdrop-filter is supported in Chrome, Edge, Safari, and Firefox 103+. For older Firefox, add -webkit-backdrop-filter as a fallback (already included in the snippet). For browsers with no support, the card still renders correctly — just without the blur behind it (the rgba background still shows).
Open-Meteo uses WMO Weather Code definitions. Map the code ranges: 0=Clear, 1-3=Partly cloudy, 45-48=Foggy, 51-67=Rain, 71-77=Snow, 80-82=Showers, 95-99=Thunderstorm. Build a lookup object: const WMO = { 0: { label: "Clear", icon: "sunny" }, ... } and index it with weathercode. For codes that fall in ranges, use a helper: function getCondition(code) { if (code === 0) return WMO[0]; if (code <= 3) return WMO[1]; if (code <= 48) return WMO[45]; ... }. Map each condition key to one of your inline SVG variants (sunny, partlyCloudy, rainy, snowy, stormy). Store SVG strings in a conditionIcons object and set innerHTML of .weather-icon using the matched icon key. This gives fully dynamic icon rendering driven by the live API weathercode value.
Accept a weather prop object: { city, country, temp, condition, feels, humidity, wind, uv, dewpoint, forecast[] }. Render the card from props. Fetch data in useEffect on mount: useEffect(() => { fetchWeather(lat, lon).then(setWeather); }, [lat, lon]). Show a skeleton loader while data is loading by rendering grey placeholder divs with an animated shimmer in the card before the weather prop is populated. Handle the error state by showing a "Could not load weather" message with a Retry button that re-triggers the fetch. For multi-location support, store an array of location objects in state and render a WeatherCard for each, passing its own lat/lon as props.