

Fundraising Campaign Leaderboard — Free Ranked Donor Table HTML CSS JS
Fundraising Campaign Leaderboard · Dashboards · Plain HTML, CSS & JS · Live preview
Copy & paste
Source Code
<div class="cl-card">
  <div class="cl-header">
    <h3>Top Fundraisers</h3>
    <span class="cl-period">Spring Gala 2026</span>
  </div>
  <ol class="cl-list" id="clList"></ol>
</div>*{box-sizing:border-box;margin:0;padding:0}
body{font-family:system-ui,-apple-system,sans-serif;background:#0f1115;color:#e8e9ee;min-height:100vh;display:flex;align-items:center;justify-content:center;padding:32px 20px}
.cl-card{background:#181b23;border:1px solid #262b38;border-radius:16px;padding:22px;width:100%;max-width:440px}
.cl-header{display:flex;align-items:baseline;justify-content:space-between;margin-bottom:16px}
.cl-header h3{font-size:17px;font-weight:800}
.cl-period{font-size:11.5px;color:#8890a3;font-weight:600}
.cl-list{list-style:none;display:flex;flex-direction:column;gap:8px}
.cl-row{display:grid;grid-template-columns:30px 1fr auto;align-items:center;gap:12px;padding:10px 10px;border-radius:12px;background:#1e222c}
.cl-row.cl-top{background:linear-gradient(90deg,rgba(250,204,21,.08),transparent)}
.cl-rank{font-size:14px;font-weight:800;color:#6b7280;text-align:center}
.cl-row[data-rank="1"] .cl-rank{color:#facc15}
.cl-row[data-rank="2"] .cl-rank{color:#cbd5e1}
.cl-row[data-rank="3"] .cl-rank{color:#d97706}
.cl-who{display:flex;align-items:center;gap:10px;min-width:0}
.cl-avatar{width:34px;height:34px;border-radius:50%;display:flex;align-items:center;justify-content:center;font-size:12.5px;font-weight:800;color:#fff;flex-shrink:0}
.cl-info{min-width:0;display:flex;flex-direction:column;gap:5px}
.cl-name{font-size:13.5px;font-weight:700;color:#e8e9ee;white-space:nowrap;overflow:hidden;text-overflow:ellipsis}
.cl-bar-track{width:100%;height:5px;background:#2a2f3c;border-radius:3px;overflow:hidden}
.cl-bar-fill{height:100%;background:linear-gradient(90deg,#818cf8,#6366f1);border-radius:3px}
.cl-row[data-rank="1"] .cl-bar-fill{background:linear-gradient(90deg,#fde047,#facc15)}
.cl-row[data-rank="2"] .cl-bar-fill{background:linear-gradient(90deg,#e2e8f0,#cbd5e1)}
.cl-row[data-rank="3"] .cl-bar-fill{background:linear-gradient(90deg,#fb923c,#d97706)}
.cl-amount{font-size:14px;font-weight:800;color:#e8e9ee;white-space:nowrap}var DATA = [
{ name: 'Marisol Vega', amount: 18400 },
{ name: 'Deshawn Cole', amount: 15250 },
{ name: 'Priya Nair', amount: 12800 },
{ name: 'Tomas Rieger', amount: 9600 },
{ name: 'Aiko Fujimori', amount: 8100 },
{ name: 'Leo Marchetti', amount: 6300 },
];
var AVATAR_COLORS = ['#6366f1', '#0ea5e9', '#14b8a6', '#f59e0b', '#ec4899', '#8b5cf6'];
function initials(name) {
return name.split(' ').map(function (p) { return p[0]; }).join('').slice(0, 2).toUpperCase();
}
var sorted = DATA.slice().sort(function (a, b) { return b.amount - a.amount; });
var top = sorted[0].amount;
var listEl = document.getElementById('clList');
listEl.innerHTML = sorted.map(function (person, i) {
var rank = i + 1;
var pct = Math.round((person.amount / top) * 100);
var color = AVATAR_COLORS[i % AVATAR_COLORS.length];
return '' +
'<li class="cl-row' + (rank <= 3 ? ' cl-top' : '') + '" data-rank="' + rank + '">' +
'<span class="cl-rank">' + rank + '</span>' +
'<span class="cl-who">' +
'<span class="cl-avatar" style="background:' + color + '">' + initials(person.name) + '</span>' +
'<span class="cl-info">' +
'<span class="cl-name">' + person.name + '</span>' +
'<span class="cl-bar-track"><span class="cl-bar-fill" style="width:' + pct + '%"></span></span>' +
'</span>' +
'</span>' +
'<span class="cl-amount">$' + person.amount.toLocaleString('en-US') + '</span>' +
'</li>';
}).join('');Extend with AI
Take This Snippet Further With AI
The AI prompt for this one is for Patreon supporters ($3 a month), along with a site with no ads. Supporters enter the passcode once and it is remembered in this browser.
What's included
Features
About this UI Snippet
Fundraising Campaign Leaderboard — Ranked Rows With Relative Progress Bars
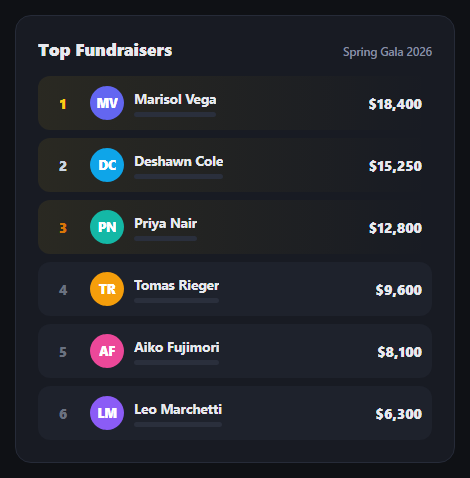
A fundraising campaign leaderboard does two jobs at once: it ranks people, and it shows *how much* separates them, not just the order. This snippet builds that as a ranked list where every row carries a small progress bar scaled relative to the top fundraiser, plus subtle medal-color treatment for the top three — in plain HTML, CSS, and vanilla JavaScript.
Sort once, derive everything from it
The raw DATA array is unsorted; a single .sort() by amount descending produces sorted, and every row's rank is just its index + 1. This keeps the source data easy to edit — add a fundraiser anywhere in the array — without ever having to manually recompute rank numbers.
Progress bars relative to the leader, not to a fixed goal
Each row's bar width is amount / top × 100, where top is the highest fundraiser's total — not a percentage of some external campaign goal. That's a deliberate choice: it makes the visual comparison read as "how close is this person to first place," which is the competitive framing a leaderboard is for for, distinct from a donation thermometer's goal-relative fill.
Medal color without medal icons
Rather than trophy emoji, rank 1–3 get a data-driven data-rank attribute that CSS attribute selectors key off of — gold, silver, and bronze tints applied to the rank number and that row's own progress-bar gradient, plus a faint background wash on .cl-top rows. It's a restrained way to signal "these three matter most" that still reads correctly in a dense list.
Initials avatars, no image dependency
Each row gets a colored circular avatar built from the fundraiser's initials and a color cycled from a fixed palette — so the component works with zero image assets or network requests, useful for a demo, a placeholder state, or any fundraiser without a photo on file.
Overflow-safe names
Names use white-space: nowrap with text-overflow: ellipsis inside a min-width: 0 flex child, so a long name truncates cleanly instead of breaking the row's grid layout — a detail that matters once the list holds real, unpredictable names.
Customizing it
Swap DATA for your live campaign totals, add avatar photos in place of the initials circles, or extend rows with a "view profile" link. Pair it with a leaderboard table for a denser variant or leaderboard podium to spotlight just the top three.
Step by step
How to Use
- 1Paste HTML, CSS, and JSA ranked leaderboard renders, sorted by amount raised, high to low.
- 2Check the top threeRanks 1–3 get gold, silver, and bronze accents on the number and bar.
- 3Compare the barsEach bar's width shows that person's total relative to the leader, not a fixed goal.
- 4Edit DATAAdd, remove, or update fundraiser names and amounts — rank recalculates automatically.
- 5Swap avatar colorsAdjust AVATAR_COLORS or replace initials circles with real photos.
- 6Connect live totalsRe-run the render whenever fundraising data updates from your backend.
Real-world uses
Common Use Cases
data-rank attribute selectors giving the top three gold, silver and bronze treatment.Got questions?
Frequently Asked Questions
A single Array.sort() call on the raw DATA array, comparing amount descending, produces the sorted list once; each row's rank is simply its position in that sorted array plus one. There is no separate rank field to keep in sync — add or edit a fundraiser in DATA and the ranking recalculates correctly on the next render.
A leaderboard's purpose is competitive comparison — how close is each person to first place — which is different from a campaign thermometer showing progress toward an external dollar goal. Dividing every amount by the top fundraiser's total keeps the bars meaningful as a head-to-head comparison regardless of what the campaign's overall goal is.
Each row carries a data-rank attribute set to its numeric rank, and CSS attribute selectors like .cl-row[data-rank="1"] apply gold, silver, or bronze tints to that row\'s rank number and progress-bar gradient. Ranks below three simply do not match those selectors and fall back to the default indigo styling.
The name sits in a flex child with min-width: 0, and the name element itself uses white-space: nowrap with text-overflow: ellipsis, so a long name truncates with an ellipsis rather than wrapping or pushing the amount out of the row. The min-width: 0 is essential — without it, flex children refuse to shrink below their content's natural width and the truncation would not take effect.
Keep the sort-then-map logic as a derived/computed value from your data source — useMemo in React, a computed() in Vue, or a getter in Angular — so the sorted list and each row\'s relative-progress percentage recalculate automatically whenever the underlying fundraiser data changes. The row markup and CSS port unchanged.