


Donation Thermometer — Free Fundraising Progress Bar HTML CSS JS
Donation Thermometer · Charts · Plain HTML, CSS & JS · Live preview
Copy & paste
Source Code
<div class="dt-card">
  <div class="dt-header">
    <h3>Winter Coat Drive</h3>
    <p>Help us keep 500 kids warm this season</p>
  </div>

  <div class="dt-body">
    <div class="dt-tube-wrap">
      <div class="dt-tube" id="dtTube" role="progressbar" aria-valuemin="0" aria-valuemax="100" aria-valuenow="0" aria-label="Funds raised toward goal">
        <div class="dt-tick dt-tick-100"><span>$10,000</span></div>
        <div class="dt-tick dt-tick-75"><span>$7,500</span></div>
        <div class="dt-tick dt-tick-50"><span>$5,000</span></div>
        <div class="dt-tick dt-tick-25"><span>$2,500</span></div>
        <div class="dt-fill" id="dtFill"></div>
      </div>
      <div class="dt-bulb"><div class="dt-bulb-fill" id="dtBulb"></div></div>
    </div>

    <div class="dt-stats">
      <div class="dt-stat">
        <span class="dt-stat-label">Raised</span>
        <span class="dt-stat-value" id="dtRaised">$0</span>
      </div>
      <div class="dt-stat">
        <span class="dt-stat-label">Goal</span>
        <span class="dt-stat-value" id="dtGoal">$10,000</span>
      </div>
      <div class="dt-stat">
        <span class="dt-stat-label">To goal</span>
        <span class="dt-stat-value dt-pct" id="dtPct">0%</span>
      </div>
    </div>

    <div class="dt-controls">
      <button type="button" class="dt-btn" id="dtAdd">+ Add $500 gift</button>
      <button type="button" class="dt-btn dt-btn-ghost" id="dtReset">Reset</button>
    </div>
  </div>
</div>*{box-sizing:border-box;margin:0;padding:0}
body{font-family:system-ui,-apple-system,sans-serif;background:#0d1117;color:#e6edf3;min-height:100vh;display:flex;align-items:center;justify-content:center;padding:32px 20px}
.dt-card{background:#151b23;border:1px solid #262f3a;border-radius:18px;padding:26px;width:100%;max-width:380px}
.dt-header h3{font-size:19px;font-weight:800;margin-bottom:4px}
.dt-header p{font-size:13px;color:#8b96a5;margin-bottom:22px}
.dt-body{display:flex;flex-direction:column;align-items:center;gap:20px}
.dt-tube-wrap{display:flex;flex-direction:column;align-items:center}
.dt-tube{position:relative;width:56px;height:260px;background:#1c2330;border:3px solid #313c4d;border-radius:28px 28px 6px 6px;overflow:hidden}
.dt-fill{position:absolute;bottom:0;left:0;width:100%;height:0%;background:linear-gradient(180deg,#ff8a3d,#f43f5e);border-radius:0 0 3px 3px;transition:height 1.1s cubic-bezier(.22,.9,.3,1)}
.dt-bulb{width:76px;height:76px;border-radius:50%;background:#1c2330;border:3px solid #313c4d;margin-top:-8px;display:flex;align-items:flex-end;justify-content:center;overflow:hidden;position:relative;z-index:2}
.dt-bulb-fill{width:100%;height:0%;background:linear-gradient(180deg,#f43f5e,#e11d48);border-radius:0 0 50% 50% / 0 0 40% 40%;transition:height 1.1s cubic-bezier(.22,.9,.3,1)}
.dt-tick{position:absolute;left:0;right:0;height:0;border-top:1px dashed #3a4557;display:flex;align-items:center;justify-content:center;transition:border-color .3s,opacity .3s}
.dt-tick span{position:absolute;left:64px;font-size:10.5px;font-weight:700;color:#8b96a5;white-space:nowrap;transition:color .3s}
.dt-tick-100{bottom:100%}
.dt-tick-75{bottom:75%}
.dt-tick-50{bottom:50%}
.dt-tick-25{bottom:25%}
.dt-tick.dt-passed{border-top-color:#f59e0b}
.dt-tick.dt-passed span{color:#f59e0b}
.dt-stats{display:flex;gap:10px;width:100%}
.dt-stat{flex:1;background:#1c2330;border-radius:10px;padding:10px 8px;text-align:center;display:flex;flex-direction:column;gap:3px}
.dt-stat-label{font-size:10.5px;color:#8b96a5;text-transform:uppercase;letter-spacing:.06em;font-weight:700}
.dt-stat-value{font-size:15px;font-weight:800;color:#e6edf3}
.dt-pct{color:#fb923c}
.dt-controls{display:flex;gap:8px;width:100%}
.dt-btn{flex:1;background:#f43f5e;color:#fff;border:none;border-radius:10px;padding:11px;font-size:13.5px;font-weight:700;cursor:pointer;transition:background .15s}
.dt-btn:hover{background:#e11d48}
.dt-btn-ghost{background:transparent;border:1px solid #313c4d;color:#8b96a5}
.dt-btn-ghost:hover{background:#1c2330;color:#e6edf3}var GOAL = 10000;
var raised = 0;
var STEP = 500;
var fillEl = document.getElementById('dtFill');
var bulbEl = document.getElementById('dtBulb');
var tubeEl = document.getElementById('dtTube');
var raisedEl = document.getElementById('dtRaised');
var pctEl = document.getElementById('dtPct');
function money(n) {
return '$' + n.toLocaleString('en-US');
}
function render() {
var pct = Math.min(100, (raised / GOAL) * 100);
fillEl.style.height = pct + '%';
bulbEl.style.height = Math.min(100, pct + 30) + '%'; // bulb fills a little ahead so it never looks empty
raisedEl.textContent = money(raised);
pctEl.textContent = Math.round(pct) + '%';
tubeEl.setAttribute('aria-valuenow', Math.round(pct));
[25, 50, 75, 100].forEach(function (mark) {
var el = document.querySelector('.dt-tick-' + mark);
el.classList.toggle('dt-passed', pct >= mark);
});
}
document.getElementById('dtAdd').addEventListener('click', function () {
raised = Math.min(GOAL, raised + STEP);
render();
});
document.getElementById('dtReset').addEventListener('click', function () {
raised = 0;
render();
});
render();Extend with AI
Take This Snippet Further With AI
The AI prompt for this one is for Patreon supporters ($3 a month, 7 days free), along with a site with no ads. Supporters enter the passcode once and it is remembered in this browser.
What's included
Features
About this UI Snippet
Donation Thermometer — A Vertical Fundraising Gauge With Milestone Ticks
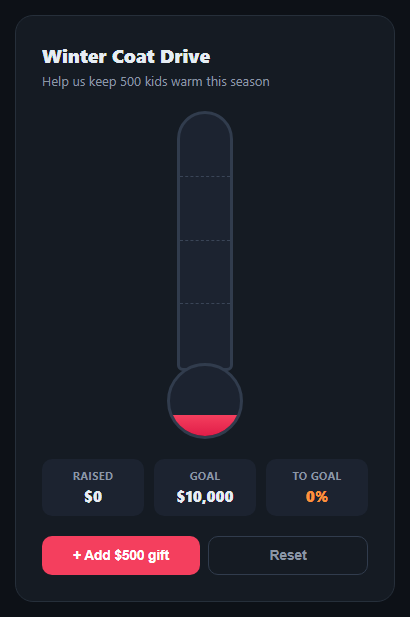
The donation thermometer is the oldest fundraising visual in the book — a mercury-style tube that rises as gifts come in, instantly communicating "how close are we" without anyone reading a number. This snippet rebuilds it in plain HTML, CSS, and vanilla JavaScript: a tube-and-bulb fill, milestone tick marks at 25/50/75/100%, and a live stats row.
Tube plus bulb, like the real thing
The visual is two parts: a tall .dt-tube and a rounded .dt-bulb beneath it, each with its own fill layer whose height is driven by the raised-to-goal ratio. The bulb fill is offset 30 points ahead of the tube's percentage so it never reads as empty at $0 — a small realism touch borrowed from actual glass thermometers, where the bulb always holds some mercury.
Milestone ticks that light up
Four dashed tick lines sit at 25%, 50%, 75%, and 100% of the tube's height, each labeled with its dollar amount. As raised crosses a threshold, that tick's .dt-passed class turns its line and label amber — a lightweight way to celebrate progress at a glance without a separate animation for every milestone.
One render() function, one source of truth
raised is a single number. Every visual — the fill heights, the raised/goal/percent stat row, and the milestone tick states — is derived from it inside one render() call, the same pattern as the rest of this library: change the number, call render(), and everything stays consistent.
Smooth, physical-feeling rise
The fill's height transitions over 1.1s with a custom cubic-bezier that overshoots slightly before settling, so each new gift feels like a real rise in liquid rather than an instant jump — pair this with a count-up on the raised figure for an even more tactile update.
Accessible by default
The tube carries role="progressbar" with live aria-valuenow, so screen readers announce the current percentage as it changes — important for a widget whose entire point is otherwise visual.
Customizing it
Swap GOAL and STEP for your campaign's real numbers, wire dtAdd to your donation webhook instead of a demo button, and change the milestone percentages or add more ticks. Pair it with a donation amount picker or a progress bar for a flatter alternative.
Step by step
How to Use
- 1Paste HTML, CSS, and JSA tube-and-bulb thermometer renders at $0 of a $10,000 goal.
- 2Click "Add $500 gift"The fill rises smoothly and the stats update.
- 3Watch the milestonesTick lines at 25/50/75/100% turn amber once passed.
- 4Click ResetThe thermometer empties back to $0.
- 5Change GOAL and STEPSet your real campaign goal and gift increment.
- 6Wire it to real donationsCall render() after adding to raised from your payment webhook.
Real-world uses
Common Use Cases
render() function.Got questions?
Frequently Asked Questions
The bulb's fill height is set to the tube's percentage plus a fixed 30-point offset, capped at 100%. That means even at 0% overall progress the bulb shows some fill, matching how a real thermometer's bulb always holds mercury — purely a visual realism choice, not tied to any real minimum amount.
Each tick element is checked against the current percentage on every render: if the raised percentage is at or above the tick's threshold (25, 50, 75, or 100), a dt-passed class is added, which switches its dashed line and label color to amber via CSS transitions. No separate timers or animations are needed — it is a direct comparison recalculated each render.
Replace the demo dtAdd button handler with your payment webhook or polling logic: whenever a new gift is confirmed, add its amount to the raised variable and call render(). Everything else — fill heights, stats, and milestone highlighting — updates automatically from that one number.
Yes. GOAL controls the denominator for every percentage calculation, so changing it rescales the whole gauge. The milestone percentages are a plain array (25, 50, 75, 100) inside the forEach loop — add, remove, or change values there, and add matching .dt-tick elements with the corresponding bottom offset in CSS.
Hold raised in component state (useState, ref(), or a component field) and derive the percentage in a computed value; bind it to the fill and bulb heights and the stat text. The render() function's logic maps directly to a computed/derived value in any framework — only the DOM-writing lines change to framework bindings.