


ECharts Calendar Heatmap — Free Contribution Graph Snippet
ECharts Calendar Heatmap · Charts · Plain HTML, CSS & JS · Live preview
Copy & paste
Source Code
<div class="ech-wrap">
  <div class="ech-card">
    <div class="ech-head">
      <div>
        <div class="ech-title">Contribution Activity — 2026</div>
        <div class="ech-sub">Darker cells mean more commits that day</div>
      </div>
      <div class="ech-total" id="echTotal">0 contributions</div>
    </div>
    <div class="ech-chart" id="echChart"></div>
  </div>
</div>*{box-sizing:border-box;margin:0;padding:0}
body{font-family:system-ui,-apple-system,sans-serif;background:#f8fafc;min-height:100vh;display:flex;align-items:center;justify-content:center;padding:24px}
.ech-wrap{width:100%;max-width:720px}
.ech-card{background:#fff;border-radius:16px;padding:22px;box-shadow:0 1px 8px rgba(0,0,0,.07);border:1px solid #e2e8f0}
.ech-head{display:flex;justify-content:space-between;align-items:flex-start;gap:12px;margin-bottom:6px;flex-wrap:wrap}
.ech-title{font-size:13px;font-weight:700;color:#0f172a}
.ech-sub{font-size:11.5px;color:#94a3b8;margin-top:3px}
.ech-total{font-size:12px;font-weight:700;color:#16a34a;white-space:nowrap}
.ech-chart{width:100%;height:220px}var el = document.getElementById('echChart');
var totalEl = document.getElementById('echTotal');
var chart = echarts.init(el);
// Deterministic pseudo-random daily counts for every day of 2026, seeded so
// the pattern (and the total) is identical on every load.
function seededRandom(seed) {
var x = Math.sin(seed) * 10000;
return x - Math.floor(x);
}
var data = [];
var total = 0;
var start = new Date(2026, 0, 1);
var end = new Date(2026, 11, 31);
var day = new Date(start);
var i = 0;
while (day <= end) {
var r = seededRandom(i * 7.13 + 1);
// Weight toward zero so most days are quiet, like a real contribution graph.
var count = r > 0.55 ? Math.round((r - 0.55) * 22) : 0;
var iso = day.getFullYear() + '-' + String(day.getMonth() + 1).padStart(2, '0') + '-' + String(day.getDate()).padStart(2, '0');
data.push([iso, count]);
total += count;
day.setDate(day.getDate() + 1);
i++;
}
totalEl.textContent = total.toLocaleString('en-US') + ' contributions';
var option = {
tooltip: {
backgroundColor: '#0f172a',
borderWidth: 0,
textStyle: { color: '#fff', fontSize: 12 },
formatter: function (p) {
var n = p.data[1];
return p.data[0] + '<br/><b>' + n + '</b> ' + (n === 1 ? 'contribution' : 'contributions');
},
},
visualMap: {
min: 0,
max: 12,
show: false,
inRange: { color: ['#ebedf0', '#c6e6c6', '#7bc96f', '#3fa14e', '#196127'] },
},
calendar: {
range: '2026',
cellSize: ['auto', 14],
left: 40,
right: 10,
top: 20,
splitLine: { lineStyle: { color: '#e2e8f0' } },
itemStyle: { borderWidth: 2, borderColor: '#fff' },
yearLabel: { show: false },
monthLabel: { color: '#94a3b8', fontSize: 10 },
dayLabel: { color: '#94a3b8', fontSize: 9, firstDay: 1 },
},
series: [{
type: 'heatmap',
coordinateSystem: 'calendar',
data: data,
}],
};
chart.setOption(option);
var ro = new ResizeObserver(function () { chart.resize(); });
ro.observe(el);Extend with AI
Take This Snippet Further With AI
The AI prompt for this one is for Patreon supporters ($3 a month), along with a site with no ads. Supporters enter the passcode once and it is remembered in this browser.
What's included
Features
About this UI Snippet
ECharts Calendar Heatmap — A Full Year of Daily Activity in One Grid
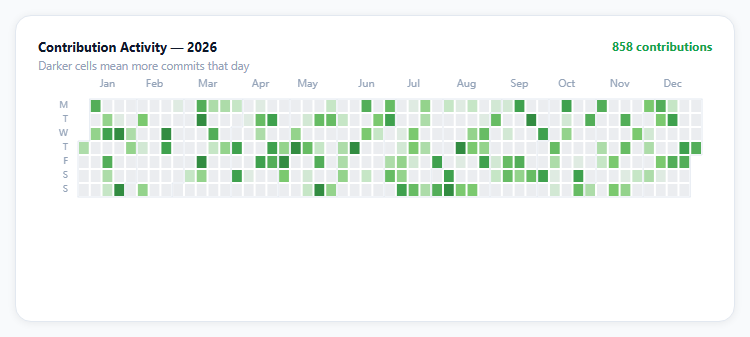
The GitHub contribution graph is one of the most recognizable data visualizations on the web — a full year compressed into a grid of colored squares, dense enough to spot streaks and gaps at a glance. Apache ECharts ships the exact building blocks for it: a calendar coordinate system that lays out a year as a week-by-day grid, and a heatmap series that colors each cell by value.
calendar is a coordinate system, not a chart type
Most ECharts series draw on a Cartesian or polar grid. heatmap here instead targets coordinateSystem: 'calendar', and the calendar component (declared as its own top-level option, like grid or polar) handles converting each date string into a cell position — you supply [date, value] pairs and never compute a row or column yourself.
visualMap drives the color scale, invisibly
The five-stop green scale (#ebedf0 through #196127, GitHub's own palette) comes from a visualMap component with show: false — it still does its job of mapping each cell's value to a color along that gradient, it just doesn't render its own legend/slider UI, which would be redundant for a calendar that's already self-explanatory.
Seeded data keeps the demo honest
The 365 daily counts come from a small seeded pseudo-random function rather than Math.random(), so the same pattern (and the same total in the header) renders on every page load — useful for anyone comparing before/after CSS tweaks, and standard practice for any demo that isn't hooked to live data.
The zero-weighted distribution matters
Real contribution graphs are mostly empty with occasional bursts, not evenly distributed. The generator weights toward zero (r > 0.55 before any commits count at all) specifically so the rendered heatmap looks like an actual usage pattern instead of uniform noise — a detail that matters more than it seems for a demo meant to be visually convincing.
Reusing it
Swap the generated data for real daily counts (from git log, an activity log table, or an analytics export keyed by date) and everything else — the color scale, month/day labels, tooltip — keeps working unchanged, since it only depends on [isoDateString, number] pairs.
Step by step
How to Use
- 1Add the ECharts CDNLoad echarts.min.js before the snippet's JS runs.
- 2Paste HTML, CSS, and JSA full year renders as a color-scaled grid of day cells.
- 3Read the header totalIt sums every day's count across the year.
- 4Hover a cellThe tooltip shows that exact date and its count.
- 5Scan for streaksDarker green runs show consistent activity.
- 6Scan for gapsLight gray cells mark days with zero activity.
Real-world uses
Common Use Cases
visualMap drives without drawing its own UI.Got questions?
Frequently Asked Questions
The heatmap series is set to coordinateSystem: 'calendar' instead of the default Cartesian grid, and a separate top-level calendar component (given a range like '2026') handles converting each [date, value] pair in the series data into the correct week-column and day-row cell position. You never compute a row or column index yourself — only supply ISO date strings and numbers.
visualMap normally renders a visible legend or slider that lets viewers interact with the color scale. Here it is used purely for its color-mapping logic — converting each cell's numeric value into a color along the five-stop green gradient — without rendering that UI, since a calendar heatmap is self-explanatory and an extra legend would be redundant clutter.
Math.random() produces a different pattern (and a different header total) on every page load, which makes the demo inconsistent for screenshots, visual regression checks, or anyone comparing two versions side by side. The seeded function derives its output from a fixed formula, so the exact same 365 values render every time the snippet runs.
Replace the generator loop with your own array of [isoDateString, count] pairs — from a database query grouped by day, a git log parse, or an analytics export. The calendar component, color scale, tooltip, and header total all read from that data array's shape and need no other changes.
Initialize the chart once against a container ref/template ref and call setOption whenever your date-keyed data changes — for a full year swap, that's just a new range value and a new data array. Dispose the instance on unmount, and keep the same ResizeObserver pattern since ECharts does not auto-resize with CSS layout changes alone.