

ECharts Funnel Conversion Chart — Free Stage-by-Stage Snippet
ECharts Funnel Conversion Chart · Charts · Plain HTML, CSS & JS · Live preview
Copy & paste
Source Code
<div class="efn-wrap">
  <div class="efn-card">
    <div class="efn-title">Checkout Funnel</div>
    <div class="efn-sub">Percentages are relative to the stage above, not the top of the funnel</div>
    <div class="efn-chart" id="efnChart"></div>
  </div>
</div>*{box-sizing:border-box;margin:0;padding:0}
body{font-family:system-ui,-apple-system,sans-serif;background:#f8fafc;min-height:100vh;display:flex;align-items:center;justify-content:center;padding:24px}
.efn-wrap{width:100%;max-width:520px}
.efn-card{background:#fff;border-radius:16px;padding:22px;box-shadow:0 1px 8px rgba(0,0,0,.07);border:1px solid #e2e8f0}
.efn-title{font-size:13px;font-weight:700;color:#0f172a}
.efn-sub{font-size:11.5px;color:#94a3b8;margin-top:3px;margin-bottom:6px}
.efn-chart{width:100%;height:340px}var el = document.getElementById('efnChart');
var chart = echarts.init(el);
var stages = [
{ name: 'Viewed Product', value: 10000 },
{ name: 'Added to Cart', value: 4200 },
{ name: 'Started Checkout', value: 2600 },
{ name: 'Entered Payment', value: 1900 },
{ name: 'Completed Order', value: 1450 },
];
// Precompute each stage's conversion relative to the PREVIOUS stage, not the
// top of the funnel -- the number that actually tells you where the biggest
// relative leak is.
var withRates = stages.map(function (s, i) {
var rate = i === 0 ? 100 : Math.round((s.value / stages[i - 1].value) * 100);
return { name: s.name, value: s.value, rate: rate };
});
var COLORS = ['#6366f1', '#7c7ff2', '#93a5f5', '#a9caf5', '#c8e0ee'];
var option = {
tooltip: {
trigger: 'item',
backgroundColor: '#0f172a',
borderWidth: 0,
textStyle: { color: '#fff', fontSize: 12 },
formatter: function (p) {
var d = withRates[p.dataIndex];
return '<b>' + d.name + '</b><br/>' + d.value.toLocaleString('en-US') + ' users<br/>' + d.rate + '% of previous stage';
},
},
series: [{
type: 'funnel',
left: '6%',
right: '6%',
top: 10,
bottom: 10,
width: '88%',
min: 0,
max: stages[0].value,
minSize: '18%',
maxSize: '100%',
sort: 'none',
gap: 3,
label: {
position: 'inside',
color: '#fff',
fontSize: 12,
fontWeight: 700,
formatter: function (p) {
var d = withRates[p.dataIndex];
return d.name + '\n' + d.value.toLocaleString('en-US') + ' (' + d.rate + '%)';
},
},
itemStyle: {
borderColor: '#fff',
borderWidth: 2,
},
data: stages.map(function (s, i) { return { name: s.name, value: s.value, itemStyle: { color: COLORS[i] } }; }),
}],
};
chart.setOption(option);
var ro = new ResizeObserver(function () { chart.resize(); });
ro.observe(el);Extend with AI
Take This Snippet Further With AI
The AI prompt for this one is for Patreon supporters ($3 a month), along with a site with no ads. Supporters enter the passcode once and it is remembered in this browser.
What's included
Features
About this UI Snippet
ECharts Funnel Conversion Chart — Stage-to-Stage Rates, Not Percent-of-Total
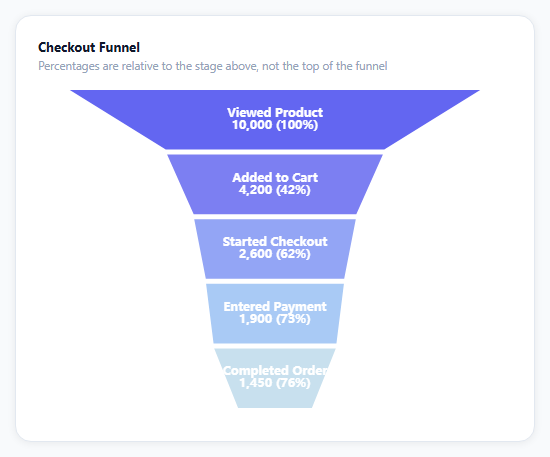
Most funnel charts show each stage as a percentage of the very top — which tells you the chart looks good overall but hides exactly where users are leaking out fastest. This snippet computes and displays each stage's conversion *relative to the stage directly above it*, which is the number a growth or product team actually needs to find the weakest step.
sort: 'none' is a deliberate override
ECharts' funnel series defaults to sorting data by value, largest first — sensible for a generic funnel, wrong here. The stages are already in their real, sequential order (viewed, added to cart, checkout, payment, completed), and re-sorting by size would scramble that sequence into something that no longer represents an actual user journey. sort: 'none' keeps the array order as the funnel's visual order.
The rate is computed once, outside the chart option
Before building option, a small .map pass walks the stages array and computes each one's rate against stages[i - 1].value (100% for the first stage, since there's no prior one). That precomputed withRates array is what both the segment labels and the tooltip formatter read from — the chart itself never does percentage math, it only renders values it's handed.
Labels carry both the count and the rate
Each segment's inline label combines the raw count and the stage-over-stage percentage on two lines ('\n' inside the formatter's returned string) — useful because a raw count alone doesn't show *where* the funnel is leaking, and a percentage alone doesn't show *how many people* that represents.
minSize keeps the bottom segment visible
With five stages spanning 10,000 down to 1,450, a funnel sized purely by proportion would shrink the final segment to a sliver too thin to read its label. minSize: '18%' floors every segment's width so the smallest stage stays legible, at the cost of the shape being only approximately proportional at the tail — a fair trade for a chart people need to actually read.
Reusing it
Replace the five checkout stages with any sequential process — onboarding steps, application review stages, a sales pipeline — and the stage-over-stage rate computation, labels, and tooltip keep working unchanged since they only depend on the stages array being in real sequence order.
Step by step
How to Use
- 1Add the ECharts CDNLoad echarts.min.js before the snippet's JS runs.
- 2Paste HTML, CSS, and JSA five-stage checkout funnel renders top to bottom.
- 3Read each segment labelIt shows the raw count and the rate from the prior stage.
- 4Hover a segmentThe tooltip repeats the count and stage-over-stage rate.
- 5Find the biggest leakThe lowest per-stage percentage is the weakest step.
- 6Compare to percent-of-totalNotice how different that view would look versus stage-over-stage.
Real-world uses
Common Use Cases
sort: 'none' so the real process order is preserved instead of being re-sorted by size.minSize stopping the smallest stage at the bottom from vanishing.Got questions?
Frequently Asked Questions
Percent-of-total tells you a stage's size compared to the very top of the funnel, which can look deceptively stable even while a specific step is leaking badly. Percent-of-previous-stage isolates exactly how much each individual transition loses, which is the number a team needs to identify which specific step to fix first.
ECharts' funnel chart defaults to sorting segments by value from largest to smallest, which is appropriate when the categories have no inherent order. Here the stages represent a real sequential process (viewed, added to cart, checkout, payment, completed), so sorting by size would scramble that sequence — sort: 'none' preserves the array's given order as the funnel's visual order.
The series sets minSize: '18%', which floors every segment's rendered width at 18% of the funnel's total width regardless of its actual proportional value. Without it, a segment representing 1,450 out of a 10,000-value scale would render as a sliver too narrow to hold its label — the trade-off is that segment widths become only approximately proportional near the bottom.
Replace the stages array with your own ordered { name, value } objects — the stage-over-stage rate calculation, the dual-line labels, and the tooltip all derive from that array's order and values automatically, as long as the stages remain listed in their real sequential order (largest expected value first is not required, only real order).
Compute the withRates array from your stage data (with useMemo in React, a computed property in Vue) before passing it into the chart option, initialize the chart once against a container ref, and call setOption whenever the stage data changes. Dispose the instance on unmount and keep the ResizeObserver pattern for responsive sizing.