



Histogram — HTML CSS JS SVG Histogram (No Library)
Histogram · Charts · Plain HTML, CSS & JS · Live preview
Copy & paste
Source Code
<div class="hg-card">
  <div class="hg-head">
    <h3>Response time distribution</h3>
    <label class="hg-bins">Bins
      <select id="hgBins"><option>8</option><option selected>12</option><option>20</option></select>
    </label>
  </div>
  <svg class="hg-svg" id="hgSvg" viewBox="0 0 380 220" role="img" aria-label="Histogram"></svg>
  <div class="hg-axis" id="hgAxis"></div>
  <div class="hg-tip" id="hgTip" hidden></div>
</div>*{box-sizing:border-box;margin:0;padding:0}
body{font-family:system-ui,-apple-system,sans-serif;background:#f1f5f9;min-height:100vh;display:flex;align-items:center;justify-content:center;padding:24px}
.hg-card{position:relative;background:#fff;border-radius:16px;padding:22px;width:100%;max-width:460px;box-shadow:0 18px 44px rgba(15,23,42,.08)}
.hg-head{display:flex;align-items:center;justify-content:space-between;margin-bottom:14px}
.hg-head h3{font-size:16px;font-weight:800;color:#0f172a}
.hg-bins{font-size:12px;font-weight:700;color:#64748b;display:flex;align-items:center;gap:7px}
.hg-bins select{border:1.5px solid #e2e8f0;border-radius:7px;padding:4px 7px;font-size:12px;font-family:inherit;font-weight:700;color:#0f172a}
.hg-svg{width:100%;height:auto;display:block}
.hg-grid{stroke:#eef2f7;stroke-width:1}
.hg-bar{fill:#6366f1;cursor:pointer;transition:fill .12s}
.hg-bar:hover{fill:#4f46e5}
.hg-axis{display:flex;justify-content:space-between;margin-top:6px;padding:0 2px;font-size:10px;font-weight:600;color:#94a3b8}
.hg-tip{position:absolute;pointer-events:none;background:#0f172a;color:#fff;font-size:12px;font-weight:700;padding:6px 10px;border-radius:8px;transform:translate(-50%,-130%);white-space:nowrap;z-index:5}
.hg-tip[hidden]{display:none}// Raw measurements (e.g. API response times in ms). A histogram bins these.
var DATA = [120,135,140,142,150,151,155,158,160,162,165,168,170,172,175,178,180,182,185,188,190,192,195,198,200,205,210,215,220,118,145,167,177,189,201,159,163,171,183,193,148,156,164,174,186,196,152,169,179,191];
var svg = document.getElementById('hgSvg');
var axis = document.getElementById('hgAxis');
var tip = document.getElementById('hgTip');
var card = document.querySelector('.hg-card');
var binsSel = document.getElementById('hgBins');
var SVGNS = 'http://www.w3.org/2000/svg';
var W = 380, H = 220, PAD = 30;
function bin(count) {
var min = Math.min.apply(null, DATA), max = Math.max.apply(null, DATA);
var width = (max - min) / count;
var bins = [];
for (var i = 0; i < count; i++) bins.push({ lo: min + i * width, hi: min + (i + 1) * width, n: 0 });
DATA.forEach(function (v) {
var idx = Math.min(count - 1, Math.floor((v - min) / width));
bins[idx].n++;
});
return bins;
}
function render() {
var count = +binsSel.value;
var bins = bin(count);
var maxN = Math.max.apply(null, bins.map(function (b) { return b.n; }));
var bw = (W - PAD * 2) / count;
svg.innerHTML = '';
for (var g = 0; g <= 4; g++) {
var gy = PAD + g * (H - PAD * 2) / 4;
svg.appendChild(line('hg-grid', PAD, gy, W - PAD, gy));
}
bins.forEach(function (b, i) {
var h = maxN ? (b.n / maxN) * (H - PAD * 2) : 0;
var x = PAD + i * bw;
var rect = document.createElementNS(SVGNS, 'rect');
rect.setAttribute('class', 'hg-bar');
rect.setAttribute('x', x + 1);
rect.setAttribute('y', H - PAD - h);
rect.setAttribute('width', bw - 2);
rect.setAttribute('height', h);
rect.setAttribute('rx', 2);
rect.dataset.range = Math.round(b.lo) + '–' + Math.round(b.hi);
rect.dataset.n = b.n;
svg.appendChild(rect);
});
// A few axis ticks across the range.
var min = Math.min.apply(null, DATA), max = Math.max.apply(null, DATA);
axis.innerHTML = [0, .25, .5, .75, 1].map(function (f) {
return '<span>' + Math.round(min + f * (max - min)) + '</span>';
}).join('');
}
function line(cls, x1, y1, x2, y2) {
var l = document.createElementNS(SVGNS, 'line');
l.setAttribute('class', cls); l.setAttribute('x1', x1); l.setAttribute('y1', y1); l.setAttribute('x2', x2); l.setAttribute('y2', y2);
return l;
}
svg.addEventListener('mousemove', function (e) {
var bar = e.target.closest('.hg-bar');
if (!bar) { tip.hidden = true; return; }
var r = card.getBoundingClientRect();
tip.innerHTML = bar.dataset.range + 'ms: <b>' + bar.dataset.n + '</b>';
tip.style.left = (e.clientX - r.left) + 'px';
tip.style.top = (e.clientY - r.top) + 'px';
tip.hidden = false;
});
svg.addEventListener('mouseleave', function () { tip.hidden = true; });
binsSel.addEventListener('change', render);
render();Extend with AI
Take This Snippet Further With AI
The AI prompt for this one is for Patreon supporters ($3 a month, 7 days free), along with a site with no ads. Supporters enter the passcode once and it is remembered in this browser.
What's included
Features
About this UI Snippet
Histogram — Bin Raw Data into Adjustable Buckets and Draw the Distribution
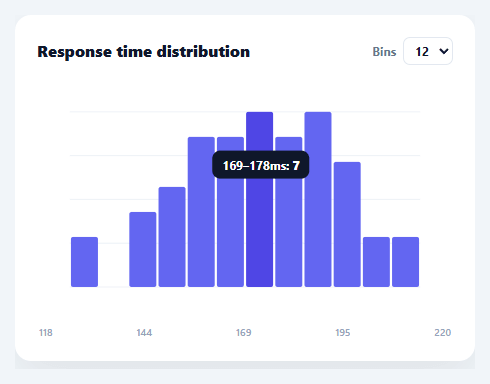
A histogram answers "how is this data distributed?" — it bins a set of raw measurements into ranges and shows how many values fall in each, revealing the shape (normal, skewed, bimodal) that a list of numbers hides. This snippet builds a real histogram in plain HTML, CSS, SVG, and vanilla JavaScript: it bins raw data itself, lets you change the bin count live, and draws adjoining bars with hover tooltips — no charting library.
Binning is the actual work
Unlike a bar chart (where you supply pre-aggregated values), a histogram takes *raw* numbers and computes the buckets. bin(count) finds the data's min and max, divides that range into equal-width bins, then drops each value into its bin by index (floor((v − min) / width)), with the maximum value clamped into the last bin so the top edge isn't lost. The output is an array of { lo, hi, n } — the frequency per range. This binning logic is what makes it a histogram rather than a bar chart, and it's the part people get subtly wrong (off-by-one at the upper edge).
Adjustable bin count
The number of bins dramatically changes a histogram's story — too few hides structure, too many turns it into noise. A selector lets you switch between 8, 12, and 20 bins and re-bins live, so you can find the resolution that reveals the distribution's real shape. Re-binning recomputes everything from the raw data, so the bars, scaling, and axis all update together.
Adjoining bars, scaled to the tallest bin
Histogram bars touch (unlike a categorical bar chart's gapped bars) because the x-axis is a continuous range, not discrete categories — the snippet draws them edge-to-edge with only a hairline separation. Each bar's height is its count as a fraction of the busiest bin, drawn as an SVG rect from the baseline up, with gridlines behind for reading frequencies.
Tooltips with the range and count
Hovering a bar shows its value range and exact count ("165–172ms: 9"), positioned at the cursor via getBoundingClientRect, with one delegated mousemove listener on the SVG. The range labels come from the bin edges, so the reader sees exactly which values each bar represents — essential for a histogram, where the bar's position encodes a range rather than a single label.
Data-driven and drop-in
Point it at any array of raw numbers — response times, ages, scores, prices — and it bins and draws the distribution. Because it's dependency-free SVG, it's crisp at any size and a clear reference for the binning algorithm and frequency scaling that underpin every histogram and distribution chart. One thing worth noting if your raw values include outliers: equal-width binning (used here) puts a handful of extreme values into mostly-empty bins out at the edges, stretching the range and squashing the interesting part of the distribution into fewer bins — for heavily skewed data, computing bin edges over a clipped percentile range instead of the true min/max usually tells a clearer story.
Step by step
How to Use
- 1Paste HTML, CSS, and JSA histogram renders, binning 50 sample measurements into adjoining frequency bars.
- 2Change the bin countUse the Bins selector (8/12/20) to re-bin the data live and see the distribution at different resolutions.
- 3Hover a barSee that bin's value range and exact count in a tooltip.
- 4Swap in your dataReplace the DATA array with your own raw numbers — binning is automatic.
- 5Add bin optionsAdd more <option> values to the selector for finer or coarser binning.
- 6Wire to an APIFetch raw values, assign them to DATA, and call render() to draw the live distribution.
Real-world uses
Common Use Cases
Got questions?
Frequently Asked Questions
A bar chart plots pre-aggregated values for discrete categories with gaps between bars. A histogram takes raw continuous data, bins it into equal-width ranges, and counts how many values fall in each — so its bars touch (the x-axis is a continuous scale) and represent ranges, not labels. This snippet does the binning itself, which is what makes it a true histogram.
Each value's bin index is floor((value − min) / binWidth). The maximum value would compute to an index equal to the bin count (one past the last bin), so it's clamped with Math.min(count − 1, …) into the final bin. Without this clamp the largest value would be dropped — the classic off-by-one error in histogram binning.
The number of bins controls the histogram's resolution. Too few bins smooth away real structure (you might miss that the data is bimodal); too many produce a spiky, noisy chart where each bin holds one or two values. Letting you switch bin counts live lets you find the count that best reveals the distribution's true shape — a core part of reading histograms.
Because the x-axis is a continuous numeric range, not a set of separate categories. Adjacent bars represent adjacent value ranges with no gap between them, so they're drawn edge-to-edge (here with a 1px hairline for legibility). Gapped bars would imply discrete categories, which is a bar chart, not a histogram.
In React, hold the raw data and bin count in useState, compute bins with useMemo, and render rects from .map() (or run the imperative render in useEffect with a ref); in Vue, use a computed bins array; in Angular, a getter with *ngFor. The bin() algorithm and scaling are framework-agnostic and port unchanged.