



Line Chart Widget — Free HTML CSS JS SVG Snippet
Line Chart Widget · Charts · Plain HTML, CSS & JS · Live preview
Copy & paste
Source Code
<div class="wrap">

  <div class="card">
    <div class="card-head">
      <div>
        <div class="card-title">Revenue</div>
        <div class="card-val">$48,295 <span class="card-change up">↑ 12.4%</span></div>
      </div>
      <div class="period-tabs">
        <button class="ptab active" onclick="setPeriod(this,0)">7d</button>
        <button class="ptab" onclick="setPeriod(this,1)">30d</button>
        <button class="ptab" onclick="setPeriod(this,2)">90d</button>
      </div>
    </div>

    <div class="chart-area">
      <svg class="chart" id="chart" viewBox="0 0 420 120" preserveAspectRatio="none">
        <defs>
          <linearGradient id="areaGrad" x1="0" y1="0" x2="0" y2="1">
            <stop offset="0%" stop-color="#6366f1" stop-opacity="0.18"/>
            <stop offset="100%" stop-color="#6366f1" stop-opacity="0"/>
          </linearGradient>
        </defs>
        <path class="area" id="area" d="" fill="url(#areaGrad)"/>
        <path class="line" id="line" d="" fill="none" stroke="#6366f1" stroke-width="2" stroke-linecap="round" stroke-linejoin="round"/>
        <circle class="dot" id="dot" r="4" fill="#6366f1" stroke="#fff" stroke-width="2"/>
        <!-- Y gridlines -->
        <line x1="0" y1="30" x2="420" y2="30" stroke="#e2e8f0" stroke-width="0.5"/>
        <line x1="0" y1="60" x2="420" y2="60" stroke="#e2e8f0" stroke-width="0.5"/>
        <line x1="0" y1="90" x2="420" y2="90" stroke="#e2e8f0" stroke-width="0.5"/>
      </svg>

      <div class="tooltip" id="tooltip" style="display:none">
        <div class="tt-date" id="tt-date"></div>
        <div class="tt-val" id="tt-val"></div>
      </div>
    </div>

    <div class="x-labels" id="x-labels"></div>

    <div class="chart-footer">
      <div class="legend-item"><span class="legend-dot indigo"></span>Revenue</div>
      <div class="stat-pair"><span class="sl">Peak</span><strong id="peak">—</strong></div>
      <div class="stat-pair"><span class="sl">Avg</span><strong id="avg">—</strong></div>
    </div>
  </div>

</div>
* { box-sizing: border-box; margin: 0; padding: 0; }
body { font-family: system-ui, sans-serif; background: #f8fafc; min-height: 100vh; display: flex; align-items: center; justify-content: center; padding: 24px; }
.wrap { width: 100%; max-width: 520px; }
.card { background: #fff; border-radius: 16px; padding: 20px; box-shadow: 0 1px 8px rgba(0,0,0,0.07); border: 1px solid #e2e8f0; }
.card-head { display: flex; justify-content: space-between; align-items: flex-start; margin-bottom: 16px; flex-wrap: wrap; gap: 10px; }
.card-title { font-size: 12px; font-weight: 600; color: #64748b; text-transform: uppercase; letter-spacing: 0.6px; }
.card-val { font-size: 24px; font-weight: 800; color: #0f172a; margin-top: 3px; display: flex; align-items: center; gap: 8px; }
.card-change { font-size: 12px; font-weight: 600; }
.card-change.up { color: #16a34a; }
.card-change.down { color: #dc2626; }
.period-tabs { display: flex; background: #f1f5f9; border-radius: 7px; padding: 2px; }
.ptab { background: transparent; border: none; font-size: 11px; font-weight: 600; color: #64748b; padding: 4px 10px; border-radius: 5px; cursor: pointer; transition: all 0.12s; }
.ptab.active { background: #fff; color: #0f172a; box-shadow: 0 1px 3px rgba(0,0,0,0.08); }
.chart-area { position: relative; height: 120px; margin: 0 -4px; }
.chart { width: 100%; height: 100%; overflow: visible; cursor: crosshair; }
.line { transition: d 0.4s ease; }
.area { transition: d 0.4s ease; }
.dot { transition: cx 0.15s, cy 0.15s; }
.tooltip { position: absolute; background: #1e293b; color: #fff; border-radius: 8px; padding: 6px 10px; font-size: 11px; pointer-events: none; white-space: nowrap; transform: translate(-50%, -120%); }
.tt-date { color: #94a3b8; font-size: 10px; }
.tt-val { font-weight: 700; font-size: 13px; }
.x-labels { display: flex; justify-content: space-between; padding: 6px 0 0; }
.x-labels span { font-size: 10px; color: #94a3b8; }
.chart-footer { display: flex; align-items: center; gap: 16px; margin-top: 12px; padding-top: 12px; border-top: 1px solid #f1f5f9; flex-wrap: wrap; }
.legend-item { display: flex; align-items: center; gap: 5px; font-size: 12px; color: #64748b; }
.legend-dot { width: 8px; height: 8px; border-radius: 50%; }
.legend-dot.indigo { background: #6366f1; }
.stat-pair { font-size: 12px; color: #64748b; display: flex; gap: 5px; }
.stat-pair strong { color: #0f172a; }
.sl { color: #94a3b8; }const datasets = [
{
label: '7d',
vals: [3200, 2800, 4100, 3900, 5200, 4800, 6100],
dates: ['Mon','Tue','Wed','Thu','Fri','Sat','Sun'],
total: '$48,295', change: '↑ 12.4%', up: true,
},
{
label: '30d',
vals: [2100,2400,2200,2900,3100,2700,3500,3800,3300,4100,3700,4400,4200,4900,4600,5100,4800,5400,5200,5700,5500,6000,5800,6300,6100,6500,6300,6700,6500,6900],
dates: ['1','5','10','15','20','25','30'],
total: '$142,800', change: '↑ 8.2%', up: true,
},
{
label: '90d',
vals: [1800,2100,1900,2400,2200,2600,2500,2900,2700,3100,2900,3300,3100,3500,3300,3700,3500,3900,3700,4100,3900,4300,4100,4600,4400,4800,4600,5100,4900,5300,5100,5500,5300,5700,5500,5900,5700,6100,5900,6300],
dates: ['Jan','Feb','Mar'],
total: '$378,500', change: '↑ 22.1%', up: true,
},
];
let currentSet = 0;
const svgW = 420, svgH = 120, pad = 10;
function renderChart(idx) {
const d = datasets[idx];
const vals = d.vals;
const min = Math.min(...vals) * 0.85;
const max = Math.max(...vals) * 1.05;
const n = vals.length;
// Build points
const pts = vals.map((v, i) => {
const x = pad + (i / (n - 1)) * (svgW - pad * 2);
const y = svgH - pad - ((v - min) / (max - min)) * (svgH - pad * 2);
return [x, y];
});
const lineD = pts.map((p, i) => (i === 0 ? 'M' : 'L') + p[0].toFixed(1) + ',' + p[1].toFixed(1)).join(' ');
const areaD = lineD + ' L' + pts[n-1][0].toFixed(1) + ',' + svgH + ' L' + pts[0][0].toFixed(1) + ',' + svgH + ' Z';
document.getElementById('line').setAttribute('d', lineD);
document.getElementById('area').setAttribute('d', areaD);
// Place dot at last point
const lp = pts[n-1];
document.getElementById('dot').setAttribute('cx', lp[0]);
document.getElementById('dot').setAttribute('cy', lp[1]);
// X labels
const xl = document.getElementById('x-labels');
xl.innerHTML = '';
d.dates.forEach(lbl => { const s = document.createElement('span'); s.textContent = lbl; xl.appendChild(s); });
// Footer stats
document.getElementById('peak').textContent = '$' + Math.max(...vals).toLocaleString();
document.getElementById('avg').textContent = '$' + Math.round(vals.reduce((a,b)=>a+b,0)/n).toLocaleString();
// Header
document.querySelector('.card-val').innerHTML = d.total + ' <span class="card-change '+(d.up?'up':'down')+'">' + d.change + '</span>';
// Mouse hover tooltip
const chart = document.getElementById('chart');
const tip = document.getElementById('tooltip');
chart.onmousemove = e => {
const r = chart.getBoundingClientRect();
const xRel = ((e.clientX - r.left) / r.width) * svgW;
let closest = 0, minD = Infinity;
pts.forEach((p, i) => { const dd = Math.abs(p[0] - xRel); if (dd < minD) { minD = dd; closest = i; } });
const p = pts[closest];
document.getElementById('dot').setAttribute('cx', p[0]);
document.getElementById('dot').setAttribute('cy', p[1]);
document.getElementById('tt-date').textContent = d.dates[closest] ?? '';
document.getElementById('tt-val').textContent = '$' + vals[closest].toLocaleString();
tip.style.display = 'block';
tip.style.left = (p[0] / svgW * 100) + '%';
tip.style.top = (p[1] / svgH * 100) + '%';
};
chart.onmouseleave = () => {
tip.style.display = 'none';
document.getElementById('dot').setAttribute('cx', lp[0]);
document.getElementById('dot').setAttribute('cy', lp[1]);
};
}
function setPeriod(btn, idx) {
document.querySelectorAll('.ptab').forEach(b => b.classList.remove('active'));
btn.classList.add('active');
currentSet = idx;
renderChart(idx);
}
renderChart(0);Extend with AI
Take This Snippet Further With AI
The AI prompt for this one is for Patreon supporters ($3 a month), along with a site with no ads. Supporters enter the passcode once and it is remembered in this browser.
What's included
Features
About this UI Snippet
Line Chart Widget — SVG Line & Area Chart with Mousemove Tooltip and Period Tab Switcher
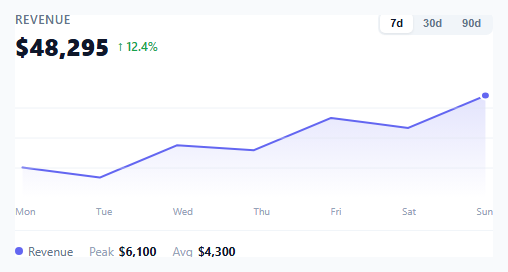
If you need a revenue or metric line chart for a dashboard without importing a charting library, this snippet builds a complete SVG line chart from scratch: a normalised SVG polyline path, a gradient area fill, a mousemove tooltip with a tracking dot, a period tab switcher (7d / 30d / 90d), and a footer with peak and average statistics — all in plain HTML, CSS, and vanilla JavaScript.
How the SVG path is generated
The chart function takes the data array and normalises each value to an SVG coordinate. The X position is evenly distributed: x = pad + (i / (n-1)) * (svgW - pad*2). The Y position inverts the scale: y = svgH - pad - ((val - min) / (max - min)) * (svgH - pad*2) — subtracting from svgH because SVG Y increases downward. These (x,y) points form an array of coordinate pairs. The SVG path D attribute is built by joining M (moveto) for the first point and L (lineto) for each subsequent point.
The gradient area fill
A linearGradient element in the SVG defs fades from indigo at 18% opacity to transparent. The area path starts at the line path, then closes back along the bottom edge of the chart (L to the last x at svgH, then L to the first x at svgH, then Z). The fill is set to url(#areaGrad).
The mousemove tooltip
On mousemove over the SVG, the mouse X position is converted from pixel coordinates to SVG coordinates using getBoundingClientRect(). The closest data point is found by comparing each point X to the converted mouse X. The tracking dot is moved to that point, and the tooltip div is positioned using percentage-based left/top derived from the SVG coordinate divided by svgW and svgH.
Period tab switcher
Three datasets (7 days, 30 days, 90 days) are stored as separate arrays. Clicking a period tab calls renderChart(idx) which regenerates all SVG paths, updates the header total and change, and refills the X axis labels and footer stats.
No library required
This pattern replaces Chart.js or Recharts for simple single-series line charts. The full implementation is under 100 lines of JavaScript.
Step by step
How to Use
- 1Hover over the chartMove the cursor across the chart area to see the tracking dot and tooltip update. The tooltip shows the date label and value for the nearest data point.
- 2Click the period tabsSwitch between 7d, 30d, and 90d. Each tab loads a different dataset, regenerates the SVG path, and updates the header total, change percentage, and footer stats.
- 3Replace the data arraysIn the JS panel, update the vals arrays in each dataset object. The chart automatically normalises any range of values to fit the 120px SVG height.
- 4Change the chart colourReplace #6366f1 in the CSS and SVG attributes with your brand hex. Update both the stroke colour on the line path and the stop-color in the linearGradient.
- 5Change the metric labelUpdate "Revenue" in the .card-title and the total/change strings in each dataset object. Add more stat-pair entries in the footer for additional metrics like Min or Total.
- 6Export in your formatClick "HTML" for a standalone file, "JSX" for a React component using useState for period and useMemo for chart path calculation, or "Tailwind" for a Tailwind CSS version.
Real-world uses
Common Use Cases
Got questions?
Frequently Asked Questions
Each data value is converted to an (x,y) SVG coordinate. X is evenly distributed: x = pad + (index / (n-1)) * (svgWidth - pad*2). Y is normalised and inverted: y = svgHeight - pad - ((value - min) / (max - min)) * (svgHeight - pad*2). Subtracting from svgHeight inverts the scale because SVG Y increases downward. These points are joined into an SVG path D string: "M x0,y0 L x1,y1 L x2,y2 ...".
The mousemove handler reads e.clientX and the chart SVG's getBoundingClientRect() to compute xRel — the cursor position in SVG coordinate units. It then iterates all point X coordinates and tracks the index with the minimum absolute distance to xRel. That index selects the tooltip label, value, and dot position. The dot and tooltip update on every mousemove event.
Add a second path element to the SVG with a different stroke colour: <path id="line2" fill="none" stroke="#10b981" stroke-width="2"/>. In renderChart(), compute pts2 from the second data array using the same coordinate math. Set document.getElementById("line2").setAttribute("d", lineD2). Add a second legend dot in the footer with the new colour.
Click "JSX" to download. Manage activePeriod with useState. Compute pts with useMemo from the active dataset — recalculate only when activePeriod or data changes. Set the SVG path d attribute via a state variable that updates when pts change. For the tooltip, use useState for hover position and onMouseMove on the SVG element.