


Tiered Usage Pricing Breakdown — Free Stepped Cost Calculator (HTML/CSS/JS)
Tiered Usage Pricing Breakdown · Pricing · Plain HTML, CSS & JS · Live preview
What's included
Features
About this UI Snippet
Tiered Usage Pricing Breakdown — Real Blended Cost Across Pricing Steps
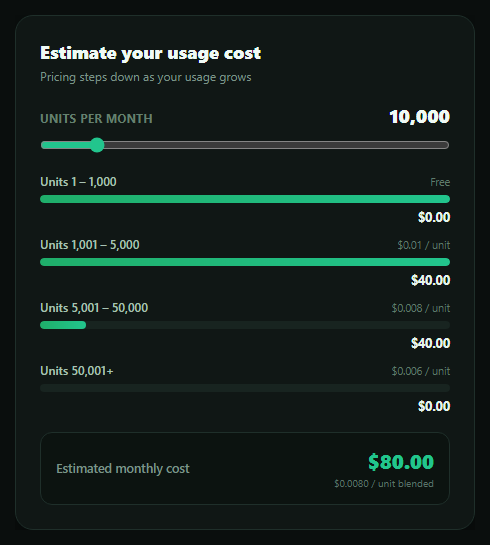
Usage-based pricing pages often show tiers as a static table and leave the actual math to the customer — this snippet does the math for them. It renders a free tier followed by two paid tiers, each with its own per-unit rate, and a units slider that computes the real blended cost by consuming usage tier by tier, exactly the way metered billing actually works.
Tier-by-tier consumption, not a flat rate
The pricing has four steps: units 1–1,000 are free, units 1,001–5,000 cost $0.01 each, units 5,001–50,000 cost $0.008 each, and units beyond 50,000 cost $0.006 each. render() computes, for each tier, exactly how many of the total units fall inside that tier's [from, to) range with Math.max(0, Math.min(units, to) - from), multiplies only that slice by the tier's rate, and sums the four tier costs — never applying one tier's rate to the whole usage figure.
Verified at three usage levels
At 10,000 units (the default): 1,000 are free, the next 4,000 cost $0.01 × 4,000 = $40, and the remaining 5,000 fall in the third tier at $0.008 × 5,000 = $40 — a total of $80.00, a blended rate of $80 ÷ 10,000 = $0.008/unit. At 50,000 units: $0 + (4,000 × $0.01 = $40) + (45,000 × $0.008 = $360) = $400.00. At 60,000 units: $0 + $40 + $360 + (10,000 × $0.006 = $60) = $460.00. Each total was computed the same tier-by-tier way the live widget computes it — the blended rate keeps dropping as usage grows, because more of the total lands in cheaper tiers.
A visual stepped bar per tier
Each tier row has its own fill bar showing how "full" that tier is relative to its own size — a tier shows 0% until usage reaches its starting point, fills toward 100% as usage passes through it, and stays at 100% once usage has moved past it into the next tier. The final open-ended tier fills to 100% the moment any usage lands in it, since it has no upper bound to measure against.
One blended number to anchor on
Beyond the itemized breakdown, a "blended $/unit" figure divides the total cost by total units — the single number that answers "what am I actually paying per unit, on average," which is always somewhere between the tiers' individual rates and drops as usage grows into cheaper tiers.
Where it fits
Pair it with a usage calculator for a simpler flat-rate estimate, place it next to a pricing card for a metered add-on, or route the estimate into a roi calculator to show cost-per-outcome.
Customizing it
Add more tiers, change the rates or breakpoints, or add a currency toggle. The tier-consumption math generalizes to any number of [from, to, rate] steps without changing the core loop.
Step by step
How to Use
- 1Paste HTML, CSS, and JSAt 10,000 units the total renders as $80.00.
- 2Drag the units sliderEach tier's bar fills and its own cost updates live.
- 3Watch the blended rate$/unit blended drops as usage grows into cheaper tiers.
- 4Push past 50,000 unitsThe fourth open-ended tier starts billing at $0.006/unit.
- 5Verify a total by handAt 60,000 units: $0 + $40 + $360 + $60 = $460.00.
- 6Wire up real tiersEdit each tier's data-from, data-to, and data-rate.
Real-world uses
Common Use Cases
Got questions?
Frequently Asked Questions
For each tier, the code computes exactly how many units fall inside that tier's from-to range with Math.max(0, Math.min(units, to) - from), multiplies only that slice by the tier's own rate, and sums the four resulting tier costs. No tier's rate is ever applied to units outside its own range — this is the same tier-by-tier consumption real metered billing uses.
Yes. The first 1,000 units are free ($0). The next 4,000 units (1,001–5,000) cost $0.01 each, so $40. The remaining 5,000 units (5,001–10,000) fall in the $0.008/unit tier, so another $40. Total: $0 + $40 + $40 = $80.00, matching what the widget shows at the default 10,000-unit position.
The blended rate is total cost divided by total units. At 10,000 units it's $80 / 10,000 = $0.008/unit. At 60,000 units it's $460 / 60,000 ≈ $0.0077/unit — slightly lower, because a larger share of total usage falls into the cheaper $0.006 and $0.008 tiers rather than the free or $0.01 tiers, pulling the average down.
Its data-to attribute is the string "Infinity", which the script converts to the actual Infinity value, so Math.min(units, Infinity) always resolves to units itself — meaning any usage above 50,000 is fully counted in that tier at $0.006/unit. Its fill bar has no tierSize to measure against, so it simply shows 100% once any usage reaches it.
Model tiers as an array of {from, to, rate} objects (using Infinity for the last tier's to) in state or a constant. Derive each tier's units-in-tier, cost, and fill percentage with a memoized loop identical to the one here, and the total and blended rate as further derived values — the math needs no DOM access at all.
Build with AI
Build, Understand, Optimize, and Extend It With AI
You don't have to re-derive tiered billing math by hand. Paste this snippet's HTML, CSS, and JS into an AI coding assistant like Claude and ask it to explain exactly how Math.max(0, Math.min(units, to) - from) isolates only the units that fall inside one tier's range, why that formula correctly returns zero for tiers usage hasn't reached yet and the full tier size for tiers usage has completely passed through, and how summing each tier's own cost produces a true blended total rather than applying one flat rate to all units. The same assistant can help you verify the math further — ask it to compute the total for a usage figure you pick and confirm it matches manual tier-by-tier arithmetic — or extend the widget: ask how to add a fifth tier, how to let someone type an exact unit count instead of only dragging a slider, or how to add a monthly-cost-forecast chart across a range of possible usage levels. Treat the code less like a finished artifact and more like a starting point for a conversation.
Prompt to recreate it
Copy this into your AI assistant of choice to build the effect from scratch, or as a jumping-off point for your own variant:
Build a "tiered usage pricing breakdown" widget in plain HTML, CSS, and JavaScript with no framework or library.

Requirements:
- Define at least four pricing tiers as data (a from-unit, a to-unit or an open-ended/infinite upper bound for the last tier, and a per-unit rate), including one free tier and one open-ended final tier billed at the lowest rate.
- Add a units input (a range slider is fine) that lets the user pick a total monthly usage amount.
- For each tier, compute the number of units from the total usage that actually fall inside that specific tier's range — not the whole usage total — using a formula equivalent to clamping (min(units, tierTo) - tierFrom) to a minimum of zero, then multiply only that amount by the tier's own rate to get that tier's cost.
- Sum every tier's individual cost to produce the true total, and also compute and display a "blended" per-unit rate (total cost divided by total units) so the user has one summary number alongside the itemized breakdown.
- Give each tier a visual fill bar showing how full that tier is relative to its own size (0% before usage reaches it, proportionally filling as usage passes through it, 100% once usage has moved beyond it) — the open-ended final tier should just show 0% or 100% since it has no fixed size.
- Before finalizing, manually verify the total at three different usage levels against your own tier rates and breakpoints, confirming each tier's contribution and the summed total are arithmetically correct — do not use a flat "usage × single rate" shortcut anywhere.
Want to tighten it up first? Run this prompt through the AI Prompt Studio to score it across 8 quality dimensions, catch anti-patterns, and tune the wording for Claude, ChatGPT, or Gemini before you paste it in.
Source Code
<div class="utb-card">
<div class="utb-head">
<h3>Estimate your usage cost</h3>
<p>Pricing steps down as your usage grows</p>
</div>
<div class="utb-input-row">
<label for="utbUnits">Units per month</label>
<span class="utb-input-value" id="utbUnitsValue">10,000</span>
</div>
<input type="range" id="utbUnits" min="0" max="80000" step="500" value="10000" />
<ul class="utb-tiers" id="utbTiers">
<li class="utb-tier" data-from="0" data-to="1000" data-rate="0">
<div class="utb-tier-info">
<span class="utb-tier-range">Units 1 – 1,000</span>
<span class="utb-tier-rate">Free</span>
</div>
<div class="utb-tier-bar"><div class="utb-tier-fill"></div></div>
<b class="utb-tier-cost">$0.00</b>
</li>
<li class="utb-tier" data-from="1000" data-to="5000" data-rate="0.01">
<div class="utb-tier-info">
<span class="utb-tier-range">Units 1,001 – 5,000</span>
<span class="utb-tier-rate">$0.01 / unit</span>
</div>
<div class="utb-tier-bar"><div class="utb-tier-fill"></div></div>
<b class="utb-tier-cost">$0.00</b>
</li>
<li class="utb-tier" data-from="5000" data-to="50000" data-rate="0.008">
<div class="utb-tier-info">
<span class="utb-tier-range">Units 5,001 – 50,000</span>
<span class="utb-tier-rate">$0.008 / unit</span>
</div>
<div class="utb-tier-bar"><div class="utb-tier-fill"></div></div>
<b class="utb-tier-cost">$0.00</b>
</li>
<li class="utb-tier" data-from="50000" data-to="Infinity" data-rate="0.006">
<div class="utb-tier-info">
<span class="utb-tier-range">Units 50,001+</span>
<span class="utb-tier-rate">$0.006 / unit</span>
</div>
<div class="utb-tier-bar"><div class="utb-tier-fill"></div></div>
<b class="utb-tier-cost">$0.00</b>
</li>
</ul>
<div class="utb-total">
<span>Estimated monthly cost</span>
<div class="utb-total-right">
<b id="utbTotal">$0.00</b>
<small id="utbBlended">$0.000 / unit blended</small>
</div>
</div>
</div>*{box-sizing:border-box;margin:0;padding:0}
body{font-family:system-ui,-apple-system,sans-serif;background:#0a0e0d;min-height:100vh;display:flex;align-items:center;justify-content:center;padding:24px}
.utb-card{background:#101715;border:1px solid #1f2f2a;border-radius:18px;padding:24px;width:100%;max-width:460px;box-shadow:0 20px 50px rgba(0,0,0,.45)}
.utb-head h3{font-size:18px;font-weight:800;color:#f0faf5}
.utb-head p{font-size:12px;color:#7c9488;margin-top:4px;margin-bottom:18px}
.utb-input-row{display:flex;align-items:baseline;justify-content:space-between;margin-bottom:8px}
.utb-input-row label{font-size:11.5px;text-transform:uppercase;letter-spacing:.04em;color:#65806f;font-weight:700}
.utb-input-value{font-size:19px;font-weight:800;color:#f0faf5;font-variant-numeric:tabular-nums}
#utbUnits{width:100%;accent-color:#22c58d;cursor:pointer;margin-bottom:20px}
.utb-tiers{list-style:none;display:flex;flex-direction:column;gap:11px;margin-bottom:18px}
.utb-tier{display:grid;grid-template-columns:1fr;gap:6px}
.utb-tier-info{display:flex;align-items:baseline;justify-content:space-between}
.utb-tier-range{font-size:12px;color:#a9c2b4;font-weight:600}
.utb-tier-rate{font-size:10.5px;color:#5f7a6a}
.utb-tier-bar{position:relative;height:8px;border-radius:99px;background:#182420;overflow:hidden}
.utb-tier-fill{position:absolute;inset:0;width:0%;background:linear-gradient(90deg,#1fae6a,#22c58d);border-radius:99px;transition:width .25s ease}
.utb-tier-cost{align-self:flex-end;font-size:12.5px;color:#e6f5ec;font-weight:700;font-variant-numeric:tabular-nums;text-align:right}
.utb-total{display:flex;align-items:center;justify-content:space-between;padding:14px 15px;background:#0c1310;border:1px solid #1f2f2a;border-radius:12px}
.utb-total span{font-size:12.5px;color:#7c9488;font-weight:600}
.utb-total-right{display:flex;flex-direction:column;align-items:flex-end;gap:2px}
.utb-total-right b{font-size:20px;font-weight:800;color:#22c58d;font-variant-numeric:tabular-nums}
.utb-total-right small{font-size:10px;color:#5a7268}var slider = document.getElementById('utbUnits');
var unitsValueEl = document.getElementById('utbUnitsValue');
var tierEls = Array.prototype.slice.call(document.querySelectorAll('.utb-tier'));
var totalEl = document.getElementById('utbTotal');
var blendedEl = document.getElementById('utbBlended');
function fmtInt(n) {
return n.toLocaleString(undefined, { maximumFractionDigits: 0 });
}
function fmtMoney(n) {
return '$' + n.toLocaleString(undefined, { minimumFractionDigits: 2, maximumFractionDigits: 2 });
}
// Real tiered/blended pricing: usage is consumed tier by tier, cheapest
// tiers first, and only the units that actually fall in a tier are billed
// at that tier's rate.
function render() {
var units = Number(slider.value);
unitsValueEl.textContent = fmtInt(units);
var total = 0;
tierEls.forEach(function (tierEl) {
var from = Number(tierEl.dataset.from);
var toRaw = tierEl.dataset.to;
var to = toRaw === 'Infinity' ? Infinity : Number(toRaw);
var rate = Number(tierEl.dataset.rate);
var tierSize = to === Infinity ? null : to - from;
var unitsInTier = Math.max(0, Math.min(units, to) - from);
var tierCost = unitsInTier * rate;
total += tierCost;
var fillPct = tierSize ? Math.min(100, (unitsInTier / tierSize) * 100) : (unitsInTier > 0 ? 100 : 0);
tierEl.querySelector('.utb-tier-fill').style.width = fillPct + '%';
tierEl.querySelector('.utb-tier-cost').textContent = fmtMoney(tierCost);
});
totalEl.textContent = fmtMoney(total);
var blended = units > 0 ? total / units : 0;
blendedEl.textContent = '$' + blended.toFixed(4) + ' / unit blended';
}
slider.addEventListener('input', render);
render();