



Range Area Chart — Min/Max Band with Average Line
Range Area Chart · Charts · Plain HTML, CSS & JS · Live preview
Copy & paste
Source Code
<div class="ra-card">
  <div class="ra-head"><h3>Daily temperature</h3><span class="ra-sub">min–max band · 7 days</span></div>
  <div class="ra-wrap">
    <svg class="ra-svg" id="raSvg" viewBox="0 0 320 180" preserveAspectRatio="none" aria-label="Range area chart"></svg>
    <div class="ra-tip" id="raTip" hidden></div>
  </div>
  <div class="ra-x" id="raX"></div>
</div>*{box-sizing:border-box;margin:0;padding:0}
body{font-family:system-ui,-apple-system,sans-serif;background:#0f172a;color:#e2e8f0;display:flex;justify-content:center;padding:32px 18px}
.ra-card{background:#1e293b;border:1px solid #334155;border-radius:16px;padding:18px;width:100%;max-width:440px}
.ra-head{display:flex;align-items:baseline;justify-content:space-between;margin-bottom:14px}
.ra-head h3{font-size:15px;font-weight:800;color:#f1f5f9}
.ra-sub{font-size:11.5px;color:#94a3b8}
.ra-wrap{position:relative}
.ra-svg{width:100%;height:180px;display:block;overflow:visible}
.ra-band{fill:url(#raGrad);opacity:.9}
.ra-grid{stroke:#334155;stroke-width:1}
.ra-edge{fill:none;stroke-width:1.5;opacity:.7}
.ra-avg{fill:none;stroke:#f8fafc;stroke-width:2.5;stroke-linecap:round;stroke-linejoin:round}
.ra-dot{fill:#f8fafc;stroke:#1e293b;stroke-width:2;opacity:0}
.ra-guide{stroke:#64748b;stroke-dasharray:3 3;opacity:0}
.ra-hit{fill:transparent;cursor:crosshair}
.ra-tip{position:absolute;transform:translate(-50%,-100%);background:#0b1120;border:1px solid #334155;border-radius:8px;padding:6px 10px;font-size:11px;color:#cbd5e1;pointer-events:none;white-space:nowrap;z-index:5}
.ra-tip b{color:#f1f5f9}
.ra-x{display:flex;justify-content:space-between;margin-top:6px;padding:0 2px;font-size:10px;color:#64748b}var DAYS = ['Mon','Tue','Wed','Thu','Fri','Sat','Sun'];
var LOW = [9,8,11,13,12,10,7];
var HIGH = [17,16,21,24,22,18,15];
var ns = 'http://www.w3.org/2000/svg';
var W = 320, H = 180, PAD = 8, N = DAYS.length;
var svg = document.getElementById('raSvg');
var tip = document.getElementById('raTip');
var card = document.querySelector('.ra-card');
var min = Math.min.apply(null, LOW) - 2, max = Math.max.apply(null, HIGH) + 2;
function x(i) { return PAD + i / (N - 1) * (W - PAD * 2); }
function y(v) { return H - PAD - (v - min) / (max - min) * (H - PAD * 2); }
function build() {
svg.innerHTML = '';
var defs = document.createElementNS(ns, 'defs');
defs.innerHTML = '<linearGradient id="raGrad" x1="0" y1="0" x2="0" y2="1"><stop offset="0%" stop-color="#f59e0b" stop-opacity="0.55"/><stop offset="100%" stop-color="#6366f1" stop-opacity="0.5"/></linearGradient>';
svg.appendChild(defs);
for (var g = 0; g <= 3; g++) { var gy = PAD + g / 3 * (H - PAD * 2); var ln = document.createElementNS(ns, 'line'); ln.setAttribute('class', 'ra-grid'); ln.setAttribute('x1', 0); ln.setAttribute('x2', W); ln.setAttribute('y1', gy); ln.setAttribute('y2', gy); svg.appendChild(ln); }
// band: high edge left-to-right, then low edge right-to-left
var d = '';
for (var i = 0; i < N; i++) d += (i ? 'L' : 'M') + x(i) + ' ' + y(HIGH[i]);
for (var j = N - 1; j >= 0; j--) d += 'L' + x(j) + ' ' + y(LOW[j]);
d += 'Z';
var band = document.createElementNS(ns, 'path'); band.setAttribute('class', 'ra-band'); band.setAttribute('d', d); svg.appendChild(band);
// edge lines
addLine(HIGH, '#f59e0b'); addLine(LOW, '#818cf8');
// average line
var avg = LOW.map(function (lo, i) { return (lo + HIGH[i]) / 2; });
var ad = avg.map(function (v, i) { return (i ? 'L' : 'M') + x(i) + ' ' + y(v); }).join('');
var ap = document.createElementNS(ns, 'path'); ap.setAttribute('class', 'ra-avg'); ap.setAttribute('d', ad); svg.appendChild(ap);
var guide = document.createElementNS(ns, 'line'); guide.setAttribute('class', 'ra-guide'); guide.setAttribute('y1', PAD); guide.setAttribute('y2', H - PAD); svg.appendChild(guide);
var dotH = mkDot(), dotL = mkDot();
for (var k = 0; k < N; k++) {
(function (idx) {
var left = idx === 0 ? 0 : (x(idx) + x(idx - 1)) / 2;
var right = idx === N - 1 ? W : (x(idx) + x(idx + 1)) / 2;
var hit = document.createElementNS(ns, 'rect'); hit.setAttribute('class', 'ra-hit'); hit.setAttribute('x', left); hit.setAttribute('width', right - left); hit.setAttribute('y', 0); hit.setAttribute('height', H);
hit.addEventListener('mouseenter', function () {
guide.setAttribute('x1', x(idx)); guide.setAttribute('x2', x(idx)); guide.style.opacity = 1;
dotH.setAttribute('cx', x(idx)); dotH.setAttribute('cy', y(HIGH[idx])); dotH.style.opacity = 1;
dotL.setAttribute('cx', x(idx)); dotL.setAttribute('cy', y(LOW[idx])); dotL.style.opacity = 1;
tip.innerHTML = '<b>' + DAYS[idx] + '</b> · ' + LOW[idx] + '° to ' + HIGH[idx] + '°';
tip.hidden = false;
var r = svg.getBoundingClientRect();
tip.style.left = (x(idx) / W * r.width) + 'px';
tip.style.top = (y(HIGH[idx]) / H * r.height - 6) + 'px';
});
hit.addEventListener('mouseleave', function () { guide.style.opacity = 0; dotH.style.opacity = 0; dotL.style.opacity = 0; tip.hidden = true; });
svg.appendChild(hit);
})(k);
}
}
function addLine(arr, color) { var d = arr.map(function (v, i) { return (i ? 'L' : 'M') + x(i) + ' ' + y(v); }).join(''); var p = document.createElementNS(ns, 'path'); p.setAttribute('class', 'ra-edge'); p.setAttribute('d', d); p.setAttribute('stroke', color); svg.appendChild(p); }
function mkDot() { var c = document.createElementNS(ns, 'circle'); c.setAttribute('class', 'ra-dot'); c.setAttribute('r', 4); svg.appendChild(c); return c; }
document.getElementById('raX').innerHTML = DAYS.map(function (d) { return '<span>' + d + '</span>'; }).join('');
build();Extend with AI
Take This Snippet Further With AI
The AI prompt for this one is for Patreon supporters ($3 a month, 7 days free), along with a site with no ads. Supporters enter the passcode once and it is remembered in this browser.
What's included
Features
About this UI Snippet
Range Area Chart — Min/Max Band, Average Line and Hover Readout
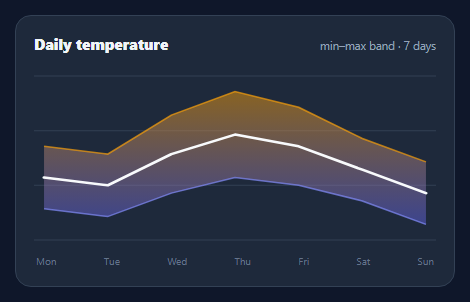
A range area chart fills the band between a low and a high series over time — daily temperature min/max, price ranges, confidence intervals, best/worst case. It shows spread, not just a single line, so you see both the trend and its uncertainty. This snippet renders one in pure SVG with a gradient band, edge lines, an average line, and a hover guide, in plain HTML, CSS, and vanilla JavaScript.
The band path
The shaded range is a single closed SVG path: it traces the high series left-to-right across the points, then the low series right-to-left back to the start, and closes — enclosing the area between them. A vertical linearGradient fill (warm at the top edge, cool at the bottom) reinforces that the top is "high" and the bottom is "low". This is the same boundary-tracing technique as an area chart, applied to two series instead of one and a baseline.
Edge and average lines
Thin lines stroke the high and low boundaries so each series stays legible at its edge, and a bright average line (the midpoint of low and high at each point) runs through the middle to show the central trend. Together they let you read the typical value and the spread around it in one glance — the whole point of a range chart over a plain line.
Responsive SVG with a clean scale
A fixed viewBox with preserveAspectRatio="none" stretches the chart to any width while the math stays in tidy coordinates, and the y-scale is padded a couple of units beyond the data so the band doesn't touch the edges. Horizontal gridlines give reference levels.
Hover guide and dual readout
Hovering shows a dashed vertical guide and dots on both the high and low edges at that point, with a tooltip giving the range ("9° to 17°"). Invisible column hit areas spanning the midpoints between points make the nearest day select reliably anywhere in its column, even near the thin edges.
Data-driven and dependency-free
The chart takes parallel LOW and HIGH arrays and an axis labels array, so changing the data or adding points needs no code edits — the band, lines, scale, and hit areas all derive from them. With no chart library, it's a clean reference for the range-band pattern used in weather, finance, and forecast UIs.
Step by step
How to Use
- 1Paste HTML, CSS, and JSA min–max temperature band renders with an average line.
- 2Use your dataEdit the LOW and HIGH arrays and the DAYS labels.
- 3Hover the chartA guide and dots show the range at that point.
- 4Read the spreadBand height is the range; the bright line is the average.
- 5RecolorChange the gradient stops and edge line colors.
- 6ResizeIt stretches to its container via preserveAspectRatio.
Real-world uses
Common Use Cases
Got questions?
Frequently Asked Questions
It is one closed SVG path: the high series is traced left-to-right across the points, then the low series is appended right-to-left back to the start, and the path is closed. This encloses exactly the area between the two boundaries. A vertical linear gradient fills it so the top reads as high and the bottom as low — the same approach as an area chart, with the low series acting as the baseline instead of zero.
The band shows spread, but readers also want the central tendency. Drawing a line through the midpoint of low and high at each point gives the typical value, so you can see both the trend and the uncertainty around it at once. Without it, a wide band can obscure where the "expected" value actually sits.
Invisible rectangle hit areas span the midpoints between points, so hovering anywhere in a column selects that point reliably. On hover, a dashed vertical guide and two dots (on the high and low edges) appear at that x, and a tooltip shows the range. Using columns rather than hit-testing the thin edge lines makes the interaction robust at any size.
Two parallel arrays — LOW and HIGH — with one value per point, plus a labels array for the x-axis. The chart computes the scale from the combined min and max (with padding) and derives the band, edge lines, average, and hit areas from these, so changing the data or adding points is just an array edit. Keep LOW, HIGH, and labels the same length.
Compute the band path, edge paths, and average path from your low/high arrays in a memo/computed and render them as SVG paths. Track the hovered index in state to drive the guide, dots, and tooltip via pointer handlers on the column rects. Recharts (Area with two bounds) or visx can replace the math; the data shape is the same. Tailwind users swap the classes for utilities.