



Bump Chart — Ranking Over Time Line Chart
Bump Chart · Charts · Plain HTML, CSS & JS · Live preview
Copy & paste
Source Code
<div class="bp-card">
  <h3>Ranking over the season</h3>
  <div class="bp-wrap">
    <svg class="bp-svg" id="bpSvg" viewBox="0 0 340 200" aria-label="Bump chart of rankings"></svg>
  </div>
  <div class="bp-legend" id="bpLegend"></div>
</div>*{box-sizing:border-box;margin:0;padding:0}
body{font-family:system-ui,-apple-system,sans-serif;background:#0f172a;color:#e2e8f0;display:flex;justify-content:center;padding:30px 18px}
.bp-card{background:#1e293b;border:1px solid #334155;border-radius:16px;padding:18px;width:100%;max-width:480px}
.bp-card h3{font-size:15px;font-weight:800;color:#f1f5f9;margin-bottom:12px}
.bp-svg{width:100%;height:auto;display:block;overflow:visible}
.bp-line{fill:none;stroke-width:3;stroke-linecap:round;stroke-linejoin:round;transition:opacity .15s,stroke-width .15s}
.bp-node{stroke:#1e293b;stroke-width:2;transition:r .15s}
.bp-col{fill:#64748b;font-size:9px;font-weight:700;text-anchor:middle}
.bp-rank{fill:#475569;font-size:9px;text-anchor:end}
.bp-dim{opacity:.18}
.bp-name{font-size:9px;font-weight:700;dominant-baseline:middle}
.bp-legend{display:flex;flex-wrap:wrap;gap:8px 14px;margin-top:12px}
.bp-leg{display:flex;align-items:center;gap:6px;font-size:12px;color:#cbd5e1;cursor:pointer}
.bp-leg span{width:12px;height:12px;border-radius:3px}
.bp-leg.is-off{opacity:.4}var ROUNDS = ['Wk1','Wk2','Wk3','Wk4','Wk5'];
var TEAMS = [
{ name:'Falcons', color:'#6366f1', ranks:[1,1,2,3,2] },
{ name:'Comets', color:'#22d3ee', ranks:[2,3,1,1,1] },
{ name:'Bolts', color:'#f59e0b', ranks:[3,2,3,2,4] },
{ name:'Sharks', color:'#34d399', ranks:[4,4,4,5,3] },
{ name:'Ravens', color:'#f472b6', ranks:[5,5,5,4,5] }
];
var ns = 'http://www.w3.org/2000/svg';
var svg = document.getElementById('bpSvg');
var W = 340, H = 200, L = 30, R = 56, T = 16, B = 16, N = ROUNDS.length, RANKS = TEAMS.length;
function x(i) { return L + i / (N - 1) * (W - L - R); }
function y(rank) { return T + (rank - 1) / (RANKS - 1) * (H - T - B); }
function draw() {
svg.innerHTML = '';
ROUNDS.forEach(function (r, i) {
var t = document.createElementNS(ns, 'text'); t.setAttribute('class', 'bp-col'); t.setAttribute('x', x(i)); t.setAttribute('y', H); t.textContent = r; svg.appendChild(t);
});
for (var rk = 1; rk <= RANKS; rk++) {
var rl = document.createElementNS(ns, 'text'); rl.setAttribute('class', 'bp-rank'); rl.setAttribute('x', L - 8); rl.setAttribute('y', y(rk) + 3); rl.textContent = '#' + rk; svg.appendChild(rl);
}
TEAMS.forEach(function (team) {
if (team.off) return;
var d = team.ranks.map(function (rank, i) { return (i ? 'L' : 'M') + x(i) + ' ' + y(rank); }).join(' ');
var path = document.createElementNS(ns, 'path');
path.setAttribute('class', 'bp-line'); path.setAttribute('d', d); path.setAttribute('stroke', team.color);
path.dataset.team = team.name;
path.addEventListener('mouseenter', function () { highlight(team.name); });
path.addEventListener('mouseleave', clear);
svg.appendChild(path);
team.ranks.forEach(function (rank, i) {
var c = document.createElementNS(ns, 'circle');
c.setAttribute('class', 'bp-node'); c.setAttribute('cx', x(i)); c.setAttribute('cy', y(rank)); c.setAttribute('r', 4.5); c.setAttribute('fill', team.color);
svg.appendChild(c);
});
// name at the last point
var last = team.ranks[N - 1];
var nm = document.createElementNS(ns, 'text'); nm.setAttribute('class', 'bp-name'); nm.setAttribute('x', x(N - 1) + 8); nm.setAttribute('y', y(last)); nm.setAttribute('fill', team.color); nm.textContent = team.name;
svg.appendChild(nm);
});
}
function highlight(name) { svg.querySelectorAll('.bp-line').forEach(function (p) { p.classList.toggle('bp-dim', p.dataset.team !== name); p.style.strokeWidth = p.dataset.team === name ? '4.5' : ''; }); }
function clear() { svg.querySelectorAll('.bp-line').forEach(function (p) { p.classList.remove('bp-dim'); p.style.strokeWidth = ''; }); }
function legend() {
document.getElementById('bpLegend').innerHTML = TEAMS.map(function (t, i) { return '<span class="bp-leg' + (t.off ? ' is-off' : '') + '" data-i="' + i + '"><span style="background:' + t.color + '"></span>' + t.name + '</span>'; }).join('');
document.querySelectorAll('.bp-leg').forEach(function (el) {
el.addEventListener('click', function () { var i = +el.getAttribute('data-i'); TEAMS[i].off = !TEAMS[i].off; draw(); legend(); });
el.addEventListener('mouseenter', function () { if (!TEAMS[+el.getAttribute('data-i')].off) highlight(TEAMS[+el.getAttribute('data-i')].name); });
el.addEventListener('mouseleave', clear);
});
}
draw(); legend();Extend with AI
Take This Snippet Further With AI
The AI prompt for this one is for Patreon supporters ($3 a month, 7 days free), along with a site with no ads. Supporters enter the passcode once and it is remembered in this browser.
What's included
Features
About this UI Snippet
Bump Chart — Rank-Over-Time Lines with Highlight and Toggle
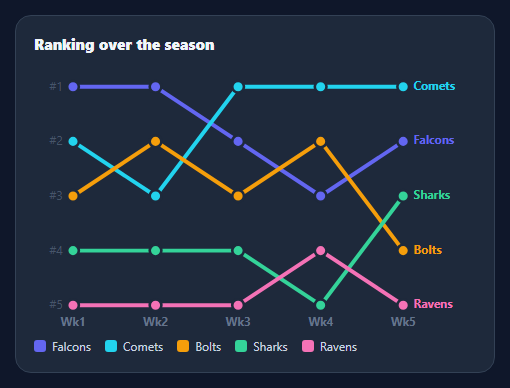
A bump chart visualises how items move up and down a ranking over time — each line is a competitor, the y-axis is rank (1 at the top), and crossings show overtakes. It's the chart for league tables, chart positions, keyword rankings, and leaderboards over a season. This snippet renders one in pure SVG with end labels, hover highlighting, and a toggling legend, in plain HTML, CSS, and vanilla JavaScript.
Rank, not value, on the y-axis
The key difference from a line chart is the scale: the y-axis is rank, with #1 at the top and the lowest rank at the bottom, evenly spaced regardless of the underlying values. Each item's path connects its rank at each period, so the slope encodes movement up or down the table and where lines cross, positions were swapped. Mapping rank to y is a simple linear scale across the number of ranks.
Lines, nodes, and end labels
Each item gets a coloured polyline through its rank points, a circular node at every period, and its name drawn at its final position — so you can read who's who without hunting in the legend. Round line caps and joins keep the bends smooth, and the period labels sit along the bottom with rank labels (#1…#n) down the side.
Highlight to follow one line
With several crossing lines a bump chart can get busy, so hovering a line (or its legend entry) dims the others and thickens the hovered one, letting you trace a single item's journey through the overtakes. This focus-by-dimming is the standard technique for making dense multi-series charts readable.
Toggle series via the legend
Clicking a legend entry removes or restores that line, so you can declutter to compare just two or three contenders. Because the chart redraws from the data (with an off flag per item), toggling is just a re-render — no fragile show/hide bookkeeping.
Data-driven and dependency-free
Each team is { name, color, ranks } where ranks is the position per period, and the periods are a labels array — so changing the contest is a data edit. With no chart library, it's a clean reference for the bump-chart pattern that's otherwise surprisingly hard to find outside D3.
Step by step
How to Use
- 1Paste HTML, CSS, and JSA bump chart renders five teams ranked across five weeks.
- 2Use your dataEdit TEAMS ({ name, color, ranks }) and the ROUNDS labels.
- 3Read the ranks#1 is at the top; crossings show overtakes.
- 4Hover a lineOthers dim so you can follow one item's path.
- 5Toggle the legendClick an entry to hide or restore that line.
- 6RestyleChange colors, node size, or chart dimensions.
Real-world uses
Common Use Cases
Got questions?
Frequently Asked Questions
A line chart plots values on the y-axis; a bump chart plots rank, with #1 at the top and ranks evenly spaced regardless of the actual values. This makes overtakes explicit — when two lines cross, those items swapped positions — and keeps the focus on relative order over time rather than absolute magnitude. It is ideal when ranking, not value, is the story.
Bump charts get visually busy because lines cross frequently. Dimming every line except the hovered one (and thickening that one) lets you trace a single item's path through all the overtakes without losing it among the crossings. It is the standard focus technique for dense multi-series charts and keeps the chart readable as you add competitors.
Yes. Each legend entry toggles an off flag on its team and re-renders, so clicking removes or restores that line. This lets you declutter to just the contenders you care about. Because the chart redraws from the data each time, there is no fragile show/hide state to manage — the visible set is always derived from the flags.
An array of periods (labels) and an array of items, each { name, color, ranks }, where ranks is that item's position at each period in order. Ranks should run 1..n with no gaps for a clean axis. The chart computes positions from the number of periods and ranks, so changing either is just a data edit.
Compute each item's path and node positions from rank using a linear scale, and render them as SVG path and circle elements. Hold a hovered item and a hidden set in state to drive the dimming and toggling. D3 or visx can replace the math for advanced cases, but the rank-to-y mapping stays the same. Tailwind users swap the classes for utilities.