


Scroll-Driven Line Chart Draw — Free Scrubbed SVG Data Viz
Scroll-Driven Line Chart Draw · Scroll · Plain HTML, CSS & JS · Live preview
Copy & paste
Source Code
<section class="lc-intro"><h1>Scroll ↓</h1><p>The revenue line draws in as you scroll — scrub it, it's tied to scroll position.</p></section>
<section class="lc-wrap" id="lcWrap">
  <div class="lc-panel">
    <div class="lc-head"><h2>Monthly recurring revenue</h2><span class="lc-badge">+184% YoY</span></div>
    <svg class="lc-svg" viewBox="0 0 640 280" preserveAspectRatio="none">
      <line class="lc-grid" x1="0" y1="40" x2="640" y2="40"></line>
      <line class="lc-grid" x1="0" y1="110" x2="640" y2="110"></line>
      <line class="lc-grid" x1="0" y1="180" x2="640" y2="180"></line>
      <line class="lc-grid" x1="0" y1="250" x2="640" y2="250"></line>
      <path class="lc-area" id="lcArea" d="M0,220 L58,205 L116,212 L174,180 L232,188 L290,150 L348,158 L406,110 L464,120 L522,70 L580,62 L640,20 L640,280 L0,280 Z"></path>
      <path class="lc-line" id="lcLine" d="M0,220 L58,205 L116,212 L174,180 L232,188 L290,150 L348,158 L406,110 L464,120 L522,70 L580,62 L640,20"></path>
      <g id="lcDots">
        <circle class="lc-dot" cx="0" cy="220" r="4"></circle>
        <circle class="lc-dot" cx="58" cy="205" r="4"></circle>
        <circle class="lc-dot" cx="116" cy="212" r="4"></circle>
        <circle class="lc-dot" cx="174" cy="180" r="4"></circle>
        <circle class="lc-dot" cx="232" cy="188" r="4"></circle>
        <circle class="lc-dot" cx="290" cy="150" r="4"></circle>
        <circle class="lc-dot" cx="348" cy="158" r="4"></circle>
        <circle class="lc-dot" cx="406" cy="110" r="4"></circle>
        <circle class="lc-dot" cx="464" cy="120" r="4"></circle>
        <circle class="lc-dot" cx="522" cy="70" r="4"></circle>
        <circle class="lc-dot" cx="580" cy="62" r="4"></circle>
        <circle class="lc-dot" cx="640" cy="20" r="4"></circle>
      </g>
    </svg>
    <div class="lc-labels" id="lcLabels">
      <span data-v="$12k">Jan</span><span data-v="$14k">Feb</span><span data-v="$13k">Mar</span><span data-v="$17k">Apr</span><span data-v="$16k">May</span><span data-v="$21k">Jun</span><span data-v="$20k">Jul</span><span data-v="$27k">Aug</span><span data-v="$26k">Sep</span><span data-v="$33k">Oct</span><span data-v="$35k">Nov</span><span data-v="$42k">Dec</span>
    </div>
  </div>
</section>
<section class="lc-outro"><p>Scroll back up — the line un-draws exactly, point by point.</p></section>*{box-sizing:border-box;margin:0;padding:0}
body{font-family:system-ui,-apple-system,sans-serif;background:#080911;color:#fff}
.lc-intro,.lc-outro{min-height:70vh;display:flex;flex-direction:column;justify-content:center;align-items:center;text-align:center;gap:10px;padding:24px}
.lc-intro h1{font-size:clamp(34px,7vw,64px);letter-spacing:-.02em}
.lc-intro p,.lc-outro p{color:#9aa0b8;font-size:16px;max-width:480px}
.lc-wrap{height:280vh;position:relative}
.lc-panel{position:sticky;top:0;height:100vh;display:flex;flex-direction:column;justify-content:center;gap:16px;max-width:720px;margin:0 auto;padding:24px}
.lc-head{display:flex;align-items:baseline;justify-content:space-between}
.lc-head h2{font-size:20px;letter-spacing:-.01em}
.lc-badge{font-size:12.5px;font-weight:800;color:#34d399;background:rgba(52,211,153,.12);padding:4px 10px;border-radius:999px}
.lc-svg{width:100%;height:auto;overflow:visible}
.lc-grid{stroke:#1c2135;stroke-width:1}
.lc-area{fill:url(#none);fill:rgba(99,102,241,.14);stroke:none;opacity:0}
.lc-line{fill:none;stroke:#22d3ee;stroke-width:3;stroke-linecap:round;stroke-linejoin:round}
.lc-dot{fill:#0b0d18;stroke:#22d3ee;stroke-width:2.5;opacity:0;transform-origin:center;transform-box:fill-box}
.lc-labels{display:flex;justify-content:space-between;font-size:11px;color:#7d84a0}
.lc-labels span{position:relative;flex:1;text-align:center}
.lc-labels span::after{content:attr(data-v);position:absolute;top:-20px;left:50%;transform:translateX(-50%);font-size:11px;font-weight:700;color:#c9d2f8;opacity:0}
.lc-labels span.is-shown::after{opacity:1}gsap.registerPlugin(ScrollTrigger);
var line = document.getElementById('lcLine');
var area = document.getElementById('lcArea');
var length = line.getTotalLength();
line.style.strokeDasharray = length;
line.style.strokeDashoffset = length;
var dots = gsap.utils.toArray('#lcDots .lc-dot');
var labelSpans = document.querySelectorAll('#lcLabels span');
// Each dot/label must pop in exactly when the drawing stroke actually
// reaches that point -- not at a uniform one-twelfth-per-point interval.
// stroke-dashoffset progresses linearly with real ARC LENGTH, but the data
// points are not evenly spaced along that length (steeper segments, like a
// big month-over-month jump, are physically longer on the path than flat
// ones), so a naive index-based stagger drifts further out of sync the
// later a point sits -- a dot can pop in noticeably before the line has
// actually drawn its way to it. Deriving each point's real cumulative
// arc-length fraction from its own cx/cy keeps every dot and label locked
// to the line's true progress at any scroll position.
var points = dots.map(function (d) {
return { x: parseFloat(d.getAttribute('cx')), y: parseFloat(d.getAttribute('cy')) };
});
var cumLen = [0];
for (var i = 1; i < points.length; i++) {
var dx = points[i].x - points[i - 1].x;
var dy = points[i].y - points[i - 1].y;
cumLen.push(cumLen[i - 1] + Math.sqrt(dx * dx + dy * dy));
}
var atFrac = cumLen.map(function (c) { return c / length; });
// A single scrubbed timeline ties every visual (the drawn stroke, the
// fading area fill, the point dots, and the value labels) to the same
// scroll-progress value, so nothing can fall out of sync when scrubbing.
var tl = gsap.timeline({
scrollTrigger: {
trigger: '#lcWrap',
start: 'top top',
end: 'bottom bottom',
scrub: 0.4
}
});
tl.to(line, { strokeDashoffset: 0, ease: 'none', duration: 1 }, 0);
tl.to(area, { opacity: 1, ease: 'none', duration: 0.6 }, 0.1);
dots.forEach(function (dot, i) {
var t = atFrac[i];
tl.to(dot, { opacity: 1, scale: 1.4, duration: 0.06, ease: 'none' }, t);
tl.to(dot, { scale: 1, duration: 0.05, ease: 'none' }, t + 0.06);
});
// Reveal each value label at the same real arc-length position as its dot.
labelSpans.forEach(function (span, i) {
tl.to(span, {
className: '+=is-shown',
duration: 0.001,
ease: 'none'
}, atFrac[i]);
});Extend with AI
Take This Snippet Further With AI
The AI prompt for this one is for Patreon supporters ($3 a month, 7 days free), along with a site with no ads. Supporters enter the passcode once and it is remembered in this browser.
What's included
Features
About this UI Snippet
Scroll-Driven Line Chart Draw — A Data Line That Draws in With Scroll
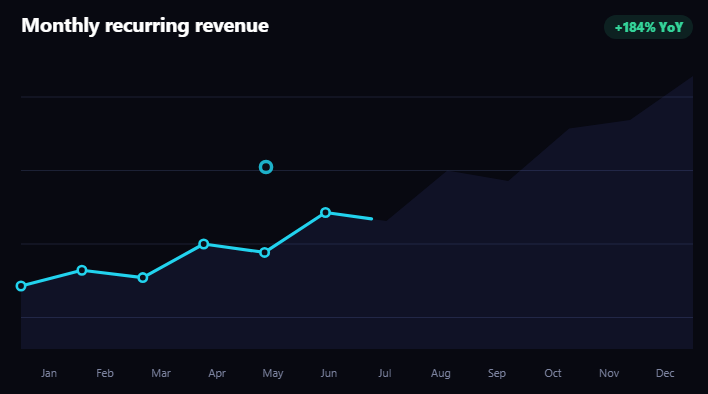
Generic scroll-triggered SVG line draws are common; this one is built specifically for data visualization. A monthly revenue line chart — real x/y points, an area fill, per-point dots, and value labels — draws itself in as you scroll, with every part of the reveal tied to the same scroll-scrubbed progress value via GSAP and ScrollTrigger loaded from a CDN.
Scrubbed, not just triggered
The ScrollTrigger uses scrub: 0.4 rather than toggleActions, which means the timeline's playhead is bound to scroll position for the whole 280vh wrapper, not just kicked off once when it enters view. Scroll a third of the way through the wrapper and the line is drawn a third of the way; scroll back and it un-draws by the same amount — this is what separates a genuine data-viz "reveal as you read" effect from a one-shot animation that merely starts on scroll.
stroke-dashoffset for the draw
The line's length is measured once with getTotalLength(), then stroke-dasharray is set to that length and stroke-dashoffset starts equal to it — fully hidden. Animating strokeDashoffset to 0 reveals the stroke from start to end, the standard SVG line-draw technique, here driven by the scrub timeline instead of a fixed duration.
One timeline, four synchronized layers
The same timeline also fades in the area fill beneath the line, pops each data-point dot with a slight overshoot scale as the draw reaches it, and reveals each month's value label — all positioned along the timeline with small offsets (stagger: 0.075) so dots and labels appear to catch up with the drawing line rather than all firing at the section's entrance. Because it's one timeline scrubbed by one ScrollTrigger, every layer stays perfectly synced at any scroll position, including mid-scrub.
Sticky panel, not pinned by JS
The chart panel uses CSS position: sticky inside the tall wrapper rather than ScrollTrigger's pin option, which keeps the implementation simpler and avoids the layout-shift ScrollTrigger's pin-spacer sometimes introduces — the wrapper's height alone provides the scroll distance the scrub timeline maps to.
Customizing it
Swap in your own data points and month labels, add a second line for a comparison series, or change scrub to a larger number like 1 for a slight catch-up lag instead of an exact 1:1 tie to scroll. Pair it with a scrollytelling chart, a scroll SVG path draw, or an always-live realtime line chart.
Step by step
How to Use
- 1Add the GSAP CDNsInclude gsap and ScrollTrigger from the CDN panel.
- 2Paste HTML, CSS, and JSAn intro, a sticky chart panel, and an outro render.
- 3Scroll through the chart sectionThe line draws, the area fills, dots and labels appear.
- 4Scrub slowly up and downThe draw progress tracks scroll position exactly, both ways.
- 5Swap in your dataEdit the path d attribute, dot cx/cy, and label text/data-v.
- 6Tune the scrub feelRaise scrub for lag, lower it for a tighter scroll tie.
Real-world uses
Common Use Cases
stroke-dashoffset technique.Got questions?
Frequently Asked Questions
The ScrollTrigger uses scrub: 0.4 instead of a toggleActions play-once trigger, which binds the timeline's playhead directly to scroll position across the whole wrapper height. Scrolling a third of the way through the section draws the line a third of the way; scrolling back un-draws it by the same amount — the draw amount is a genuine function of scroll position, verifiable by scrubbing.
The path's total length is measured once with getTotalLength(). stroke-dasharray is set to that length (creating one dash the length of the whole line and one equally long gap), and stroke-dashoffset starts at the same value, which shifts the dash fully out of view. Animating stroke-dashoffset down to 0 reveals the stroke progressively from its start point to its end point.
Putting the area fade, dot pops, and label reveals on the same GSAP timeline as the line draw, each positioned with a small time offset, means they all read from the identical scrub-driven playhead position. That guarantees they stay in sync at any scroll position — including mid-scroll or scrolling backward — rather than risking drift if they were driven by separate, independently-timed triggers.
Yes — replace the path's d attribute coordinates, the cx/cy on each .lc-dot circle, and the text/data-v attributes in .lc-labels with your own values scaled to the SVG's 640x280 viewBox. The stroke-dashoffset draw technique works with any path shape since getTotalLength measures whatever path is present.
Render the SVG with refs on the path elements, then in a mount effect register ScrollTrigger, measure getTotalLength on the line ref, and build the same scrubbed timeline scoped with gsap.context to a container ref. Return a cleanup that reverts the context so the ScrollTrigger instance and any timeline are removed on unmount.