




Scrollytelling Chart — Free HTML CSS JS Snippet
Scrollytelling Chart · Scroll · Plain HTML, CSS & JS · Live preview
Copy & paste
Source Code
<section class="ssc-intro"><p>Scroll ↓</p></section>
<section class="ssc-wrap">
  <div class="ssc-steps">
    <div class="ssc-step" data-step="0"><h3>2021 — The baseline</h3><p>Five regions, one flat market. Nobody stands out yet, and the spread between best and worst is barely 20 points.</p></div>
    <div class="ssc-step" data-step="1"><h3>2022 — The west wakes up</h3><p>A single product launch doubles the West region while everyone else treads water.</p></div>
    <div class="ssc-step" data-step="2"><h3>2023 — The chasing pack</h3><p>Playbooks get copied. North and South close the gap, and the market's center of gravity shifts.</p></div>
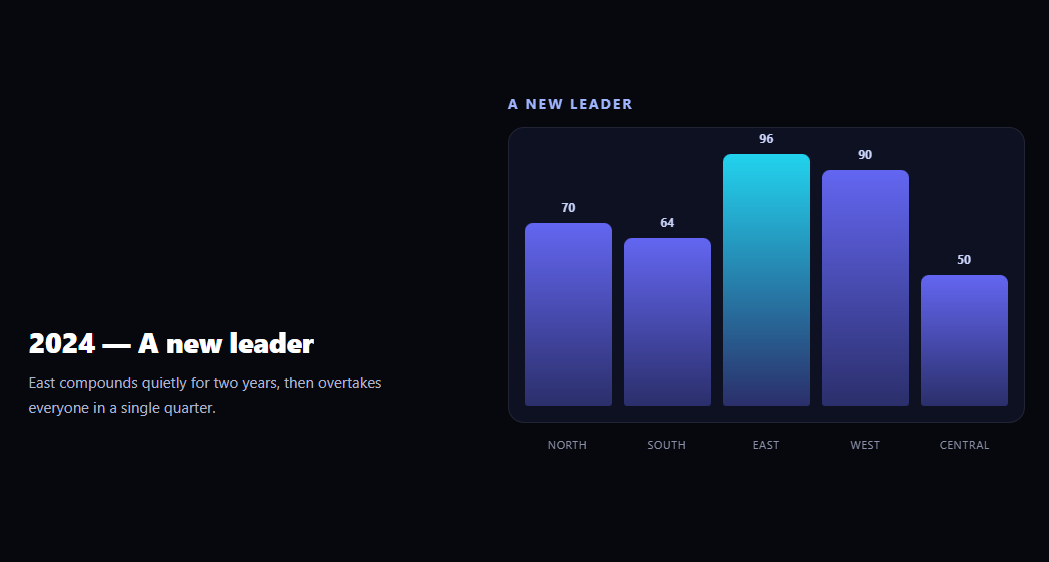
    <div class="ssc-step" data-step="3"><h3>2024 — A new leader</h3><p>East compounds quietly for two years, then overtakes everyone in a single quarter.</p></div>
  </div>
  <div class="ssc-sticky">
    <div class="ssc-panel">
      <div class="ssc-title" id="sscTitle">The baseline</div>
      <div class="ssc-chart" id="sscChart"></div>
      <div class="ssc-axis"><span>North</span><span>South</span><span>East</span><span>West</span><span>Central</span></div>
    </div>
  </div>
</section>
<section class="ssc-outro"><p>One chart, four datasets — narrated by scroll position.</p></section>*{box-sizing:border-box;margin:0;padding:0}
body{font-family:system-ui,-apple-system,sans-serif;background:#07080d;color:#fff}
.ssc-intro,.ssc-outro{min-height:60vh;display:flex;justify-content:center;align-items:center;color:#8a90a8;font-size:15px;letter-spacing:.1em;text-transform:uppercase}
.ssc-wrap{display:grid;grid-template-columns:5fr 6fr;gap:clamp(20px,4vw,56px);max-width:1040px;margin:0 auto;padding:0 22px}
.ssc-step{min-height:85vh;display:flex;flex-direction:column;justify-content:center;gap:10px;opacity:.3;transition:opacity .4s}
.ssc-step.is-active{opacity:1}
.ssc-step h3{font-size:clamp(20px,3vw,28px);font-weight:800;letter-spacing:-.01em}
.ssc-step p{color:#aeb4ca;font-size:15px;line-height:1.65;max-width:360px}
.ssc-sticky{position:relative}
.ssc-panel{position:sticky;top:0;height:100vh;display:flex;flex-direction:column;justify-content:center;gap:14px}
.ssc-title{font-size:14px;font-weight:700;letter-spacing:.14em;text-transform:uppercase;color:#9fb4ff}
.ssc-chart{display:flex;align-items:flex-end;gap:12px;height:min(300px,38vh);padding:16px;border-radius:16px;background:#0d1122;border:1px solid rgba(255,255,255,.08)}
.ssc-bar{position:relative;flex:1;border-radius:8px 8px 3px 3px;background:linear-gradient(180deg,var(--bc,#6366f1),rgba(99,102,241,.35));transition:height .8s cubic-bezier(.22,1,.36,1),background .5s;min-height:6px}
.ssc-bar em{position:absolute;top:-24px;left:50%;transform:translateX(-50%);font-style:normal;font-size:12px;font-weight:700;color:#c9d2f8;font-variant-numeric:tabular-nums}
.ssc-bar.is-lead{--bc:#22d3ee}
.ssc-axis{display:flex;gap:12px;padding:0 16px}
.ssc-axis span{flex:1;text-align:center;font-size:11px;letter-spacing:.06em;text-transform:uppercase;color:#8a90a8}
@media (max-width:760px){.ssc-wrap{grid-template-columns:1fr}.ssc-sticky{display:none}.ssc-step{opacity:1;min-height:55vh}}// Datasets: one row per story step (values 0–100), plus a title and
// which bar leads. Swapping rows is the whole "morph".
var STEPS = [
{ title: 'The baseline', values: [38, 34, 30, 42, 36], lead: 3 },
{ title: 'The west wakes up',values: [40, 36, 34, 84, 38], lead: 3 },
{ title: 'The chasing pack', values: [66, 60, 48, 88, 42], lead: 3 },
{ title: 'A new leader', values: [70, 64, 96, 90, 50], lead: 2 }
];
var chart = document.getElementById('sscChart');
var titleEl = document.getElementById('sscTitle');
var steps = document.querySelectorAll('.ssc-step');
// Build the bars once; steps only change heights and classes.
STEPS[0].values.forEach(function () {
var bar = document.createElement('div');
bar.className = 'ssc-bar';
bar.innerHTML = '<em></em>';
chart.appendChild(bar);
});
var bars = chart.children;
function applyStep(index) {
var data = STEPS[index];
titleEl.textContent = data.title;
for (var i = 0; i < bars.length; i++) {
bars[i].style.height = data.values[i] + '%';
bars[i].querySelector('em').textContent = data.values[i];
bars[i].classList.toggle('is-lead', i === data.lead);
}
steps.forEach(function (s, i) { s.classList.toggle('is-active', i === index); });
}
applyStep(0);
// Fire when a step's text crosses the middle band of the viewport.
var observer = new IntersectionObserver(function (entries) {
entries.forEach(function (entry) {
if (entry.isIntersecting) {
applyStep(Number(entry.target.getAttribute('data-step')));
}
});
}, { rootMargin: '-45% 0px -45% 0px', threshold: 0 });
steps.forEach(function (step) { observer.observe(step); });Extend with AI
Take This Snippet Further With AI
The AI prompt for this one is for Patreon supporters ($3 a month, 7 days free), along with a site with no ads. Supporters enter the passcode once and it is remembered in this browser.
What's included
Features
About this UI Snippet
Scrollytelling Chart — A Sticky Chart Narrated by Scroll Position
Scrollytelling is the data-journalism pattern popularized by the NYT and The Pudding: narrative steps scroll up one column while a sticky chart beside them morphs to illustrate each step. The reader controls the pace; the chart always shows the data for the paragraph they're reading. This snippet builds the full scrollama-style setup — sticky graphic, step detection, dataset morphing — in vanilla HTML, CSS, and an IntersectionObserver, with no charting or animation library.
The chart is data-driven from a steps array
All content lives in a STEPS array: each entry holds a title, five values, and which bar leads. The bars are built once from the first row; advancing a step only rewrites heights, labels, and a lead class. That separation — build once, restyle per step — is what makes the morph feel like *one chart changing* rather than charts being swapped, and it means adding a step is adding a data row, not markup.
CSS transitions are the animation engine
applyStep just writes height: NN% inline; the 0.8s cubic-bezier(.22,1,.36,1) transition on .ssc-bar animates every bar to its new value with a slight overshoot settle. Letting CSS interpolate means the JavaScript never runs per-frame — the observer fires four times across the whole section, and the browser tweens the rest on the compositor-adjacent fast path for height-in-a-flex-row.
Step detection uses a middle-band observer
Each narrative step is watched with rootMargin: '-45% 0px -45% 0px', collapsing the detection zone to a 10%-tall band across the viewport's center. A step triggers exactly when its text is where the reader's eyes are, and only one step can occupy the band at a time — the scrollama library's core trick, in six lines. Scrolling upward re-fires earlier steps automatically, so the story is fully bidirectional.
position: sticky keeps the graphic in view
The chart panel is position: sticky; top: 0; height: 100vh inside a column as tall as all four steps, so it pins while steps pass and releases at the section's edges with no JavaScript pinning and none of the jump artifacts pinning libraries can introduce.
The lead-bar highlight carries the narrative
Each dataset marks a lead index; that bar swaps to a cyan gradient via the is-lead class. Color is doing narrative work here — in step four, the highlight physically jumps from West to East at the same moment the text announces the overtake, which is the kind of text/graphic synchronization scrollytelling exists for. Value labels use tabular-nums so they don't jitter as digits change.
Steps dim rather than hide
Inactive steps sit at 30% opacity, keeping the story's shape visible while focusing the active paragraph — and on mobile the sticky column hides entirely, letting steps read as a plain article (add per-step inline charts there if needed).
Customizing it
Add datasets (bars rebuild from the first row's length), restyle bars into columns, dots, or lines, or drive any DOM-based graphic — maps, diagrams, counters — from applyStep. Related: scroll story steps with a pinned panel, the bar chart base component, sticky scroll features for the marketing cousin, and a scroll year timeline for date-driven stories.
Step by step
How to Use
- 1Paste HTML, CSS, and JSNo CDNs — sticky CSS and an observer do everything.
- 2Scroll into the storyThe chart pins while step one's text is centered.
- 3Keep scrollingEach step morphs the bars to its dataset.
- 4Watch the lead barThe cyan highlight jumps as the story turns.
- 5Scroll back upEarlier steps re-fire — the story rewinds.
- 6Edit the STEPS arrayTitles, values, and lead index drive everything.
Real-world uses
Common Use Cases
Got questions?
Frequently Asked Questions
An IntersectionObserver watches every step with rootMargin: '-45% 0px -45% 0px', shrinking detection to a thin band across the viewport's middle. A step intersects only while its text occupies that band — where the reader is actually looking — and applyStep fires with its index. It's the core trick of the scrollama library, implemented in a few lines.
applyStep writes each bar's height as an inline percentage, and a CSS transition — 0.8s with a cubic-bezier(.22,1,.36,1) overshoot — interpolates from the old value. JavaScript runs only at step boundaries (four times total), not per frame; the browser does all tweening. The bars are plain flex-column divs, so no canvas or SVG library is involved.
Because the morph is the message: seeing East's bar physically grow past West communicates "overtake" in a way a hard swap can't. Building bars once from the first dataset and only rewriting heights, labels, and the lead class guarantees visual continuity and keeps DOM churn at zero during the story.
Add rows to the STEPS array and matching .ssc-step blocks with incremented data-step indexes — bars, labels, and highlights all derive from the data. Values are percentages of the chart height, so normalize your real numbers to 0–100 (or compute the max and scale). applyStep can drive any DOM graphic, not just bars: maps, counters, or diagrams.
Keep the sticky layout in CSS (Tailwind: sticky top-0 h-screen) and hold the active step index in state, set from an IntersectionObserver registered in a mount effect — useEffect, onMounted, or ngAfterViewInit — and disconnected in the cleanup. Render bars from the active dataset and let the same CSS transitions animate between renders; heights as inline styles diff cleanly in all three frameworks.