

Gradient Stat Ring — Free HTML CSS JS Progress Ring Snippet
Gradient Stat Ring · Charts · Plain HTML, CSS & JS · Live preview
Copy & paste
Source Code
<div class="gr-grid" id="grGrid">
  <div class="gr-card">
    <svg class="gr-ring" viewBox="0 0 120 120" data-value="74">
      <defs><linearGradient id="grA" x1="0" y1="0" x2="1" y2="1"><stop offset="0" stop-color="#34d399"/><stop offset="1" stop-color="#22d3ee"/></linearGradient></defs>
      <circle class="gr-track" cx="60" cy="60" r="52"/>
      <circle class="gr-fill" cx="60" cy="60" r="52" stroke="url(#grA)"/>
      <text class="gr-pct" x="60" y="66">0%</text>
    </svg>
    <div class="gr-label">Storage used</div>
  </div>
  <div class="gr-card">
    <svg class="gr-ring" viewBox="0 0 120 120" data-value="92">
      <defs><linearGradient id="grB" x1="0" y1="0" x2="1" y2="1"><stop offset="0" stop-color="#a78bfa"/><stop offset="1" stop-color="#ec4899"/></linearGradient></defs>
      <circle class="gr-track" cx="60" cy="60" r="52"/>
      <circle class="gr-fill" cx="60" cy="60" r="52" stroke="url(#grB)"/>
      <text class="gr-pct" x="60" y="66">0%</text>
    </svg>
    <div class="gr-label">Goal progress</div>
  </div>
  <div class="gr-card">
    <svg class="gr-ring" viewBox="0 0 120 120" data-value="48">
      <defs><linearGradient id="grC" x1="0" y1="0" x2="1" y2="1"><stop offset="0" stop-color="#fbbf24"/><stop offset="1" stop-color="#f97316"/></linearGradient></defs>
      <circle class="gr-track" cx="60" cy="60" r="52"/>
      <circle class="gr-fill" cx="60" cy="60" r="52" stroke="url(#grC)"/>
      <text class="gr-pct" x="60" y="66">0%</text>
    </svg>
    <div class="gr-label">CPU load</div>
  </div>
</div>*{box-sizing:border-box;margin:0;padding:0}
body{font-family:system-ui,-apple-system,sans-serif;background:#0b0e16;display:flex;justify-content:center;align-items:center;min-height:100vh;padding:24px}
.gr-grid{display:flex;flex-wrap:wrap;gap:18px}
.gr-card{background:#141925;border:1px solid #232b3d;border-radius:18px;padding:20px;display:flex;flex-direction:column;align-items:center;gap:12px;width:170px}
.gr-ring{width:120px;height:120px;transform:rotate(-90deg)}
.gr-track{fill:none;stroke:#222a3a;stroke-width:10}
.gr-fill{fill:none;stroke-width:10;stroke-linecap:round;transition:stroke-dashoffset 1.3s cubic-bezier(.22,1,.36,1)}
.gr-pct{fill:#fff;font-size:24px;font-weight:800;text-anchor:middle;transform:rotate(90deg);transform-origin:60px 60px;font-variant-numeric:tabular-nums}
.gr-label{color:#8a94a8;font-size:13px;font-weight:500}var rings = Array.prototype.slice.call(document.querySelectorAll('.gr-ring'));
var R = 52;
var CIRC = 2 * Math.PI * R; // circumference of the progress circle
rings.forEach(function (svg) {
var fill = svg.querySelector('.gr-fill');
// Lay the dash out as one full ring, then hide all of it to start.
fill.style.strokeDasharray = CIRC;
fill.style.strokeDashoffset = CIRC;
});
function animateTo(svg) {
var value = Math.max(0, Math.min(100, parseFloat(svg.dataset.value)));
var fill = svg.querySelector('.gr-fill');
var text = svg.querySelector('.gr-pct');
// Reveal a fraction of the ring by shortening the dash offset.
fill.style.strokeDashoffset = CIRC * (1 - value / 100);
// Count the percentage label up to match the sweep duration.
var start = null, dur = 1300;
function frame(t) {
if (start === null) start = t;
var p = Math.min((t - start) / dur, 1);
var eased = 1 - Math.pow(1 - p, 3);
text.textContent = Math.round(value * eased) + '%';
if (p < 1) requestAnimationFrame(frame);
}
requestAnimationFrame(frame);
}
// Animate the rings when the grid scrolls into view, once.
var io = new IntersectionObserver(function (entries) {
entries.forEach(function (e) {
if (e.isIntersecting) { rings.forEach(animateTo); io.disconnect(); }
});
}, { threshold: 0.3 });
io.observe(document.getElementById('grGrid'));Extend with AI
Take This Snippet Further With AI
The AI prompt for this one is for Patreon supporters ($3 a month, 7 days free), along with a site with no ads. Supporters enter the passcode once and it is remembered in this browser.
What's included
Features
About this UI Snippet
Gradient Stat Ring — Circular Progress With a Counting Label
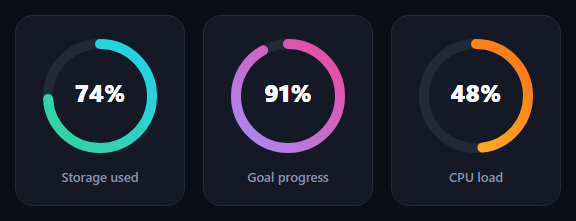
The gradient stat ring is the circular progress indicator you see on dashboards and fitness apps — a gradient arc that sweeps around to represent a percentage while the number in the centre counts up to match. This snippet builds a responsive grid of them with pure SVG, CSS, and a small vanilla JavaScript driver, with no charting library.
Stroke-dash geometry
Each ring is two stacked SVG circles: a muted track and a coloured fill, both with the same radius. The fill's progress is controlled by the classic stroke-dasharray / stroke-dashoffset trick. The dash array is set to the full circumference (2πr) so a single dash wraps the whole circle, and the offset is then set to the same length to hide it entirely. Animating the offset down to circumference × (1 − value/100) reveals exactly that fraction of the arc, which is how the ring "fills".
Why the SVG is rotated
By default SVG circles start their stroke at 3 o'clock, so the whole <svg> is rotated -90deg to move the start point to 12 o'clock — the natural top-of-the-clock origin people expect from a progress ring. The centre percentage <text> is then counter-rotated 90deg around the ring's centre so the label stays upright despite the parent rotation.
Gradient strokes
Each fill is painted with stroke="url(#id)" referencing an SVG <linearGradient>, giving the arc a two-colour gradient that reads as premium and distinguishes one metric from another. Because the gradient is defined per-SVG with a unique id, several rings can carry different colour ramps on the same page without clashing.
Synchronised sweep and count
The arc animation is pure CSS — a transition on stroke-dashoffset with an ease-out cubic-bezier so it decelerates as it lands. The centre number is animated separately in JavaScript with requestAnimationFrame over the same duration and an ease-out curve, so the label and the arc finish together. The figure uses font-variant-numeric: tabular-nums so it does not jitter horizontally while counting.
Scroll-triggered, once
An IntersectionObserver starts every ring when the grid is 30% in view and then disconnects, so the fill and count play exactly once as the section appears — the standard performant trigger, with no scroll listener. Values are clamped to 0–100 so out-of-range data can't overdraw the arc.
Customizing it
Set each ring's target with a data-value attribute, change the gradient stops, adjust the stroke-width for thicker or thinner arcs, or tune the transition duration. Add more cards and the grid wraps responsively. Pair the rings with a metric card grid or a glass stat card for a complete dashboard panel.
Step by step
How to Use
- 1Paste HTML, CSS, and JSThree stat rings render empty at 0%.
- 2Scroll them into viewEach arc sweeps to its value and the number counts up.
- 3Note the gradientsEvery ring carries its own two-colour stroke.
- 4Set a valueChange a ring's data-value attribute.
- 5Recolor a ringEdit its linearGradient stops.
- 6Adjust thicknessTune the stroke-width on track and fill.
Real-world uses
Common Use Cases
linearGradient definition.Got questions?
Frequently Asked Questions
Each ring is two SVG circles — a track and a fill — with the fill controlled by stroke-dasharray and stroke-dashoffset. The dash array equals the circumference, 2 times pi times r, so one dash wraps the circle; the offset starts at the full length to hide it, then animates down to circumference times (1 minus value over 100) to reveal exactly that fraction.
By default an SVG circle's stroke begins at 3 o'clock, so the whole svg is rotated -90 degrees to move the start to 12 o'clock, the origin people expect from a progress ring. The centre percentage text is counter-rotated 90 degrees around the ring's centre so the label stays upright.
The arc uses a CSS transition on stroke-dashoffset with an ease-out cubic-bezier. The centre number is animated separately with requestAnimationFrame over the same duration and an ease-out curve, so both finish together. The figure uses tabular-nums so it does not shift horizontally while counting.
Yes. Each fill references its own SVG linearGradient by id with stroke="url(#id)", so every ring can carry a distinct two-colour ramp on the same page without clashing. Change the gradient stops to recolour a ring, and keep the ids unique per ring.
Render the SVG in your template and compute strokeDashoffset from a value prop as circumference times (1 minus value/100). Run the centre count-up in a mount effect with requestAnimationFrame, writing to a ref'd text node, and start it from an IntersectionObserver. Give each gradient a unique id (e.g. include the component key) so multiple instances do not collide.