

Live Market Watchlist Table
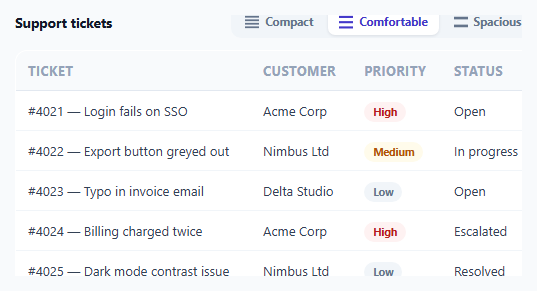
Table Row Density Toggle — Compact / Comfortable / Spacious, Persisted

Table Export with Column Selector — Choose Exactly What Gets Exported
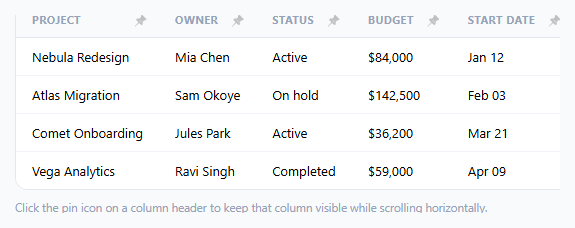
Table Column Pin/Unpin Toggle — User-Controlled Sticky Columns

Shift-Click Range Select in a Table (Gmail/Sheets-Style)

Table Column Visibility Toggle Menu
Live Market Watchlist Table — Free HTML CSS JS Snippet
Live Market Watchlist Table · Tables · Plain HTML, CSS & JS · Live preview
Copy & paste
Source Code
<div class="wrap">
  <div class="table-head">
    <h2 class="table-title">Watchlist</h2>
    <span class="live-dot"><i></i>Live</span>
  </div>
  <div class="table-scroll">
    <table class="tbl">
      <thead>
        <tr>
          <th>Symbol</th>
          <th class="num">Price</th>
          <th class="num">24h change</th>
          <th class="spark-col">Trend</th>
        </tr>
      </thead>
      <tbody id="tbody"></tbody>
    </table>
  </div>
</div>
* { box-sizing: border-box; margin: 0; padding: 0; }
body { font-family: system-ui, sans-serif; background: #f8fafc; min-height: 100vh; padding: 32px 20px; }
.wrap { max-width: 640px; margin: 0 auto; }
.table-head { display: flex; align-items: center; justify-content: space-between; margin-bottom: 12px; }
.table-title { font-size: 18px; font-weight: 800; color: #0f172a; }
.live-dot { display: flex; align-items: center; gap: 6px; font-size: 11.5px; font-weight: 700; color: #16a34a; }
.live-dot i { width: 7px; height: 7px; border-radius: 50%; background: #22c55e; display: block; animation: live-blink 1.6s ease-in-out infinite; }
@keyframes live-blink { 0%, 100% { opacity: 1; } 50% { opacity: 0.35; } }
.table-scroll { overflow-x: auto; border-radius: 12px; box-shadow: 0 1px 6px rgba(0,0,0,0.06); }
.tbl { width: 100%; border-collapse: collapse; background: #fff; }
.tbl thead tr { background: #f8fafc; }
.tbl th { padding: 11px 14px; text-align: left; font-size: 11px; font-weight: 700; text-transform: uppercase; letter-spacing: 0.5px; color: #64748b; border-bottom: 1px solid #e2e8f0; }
.tbl th.num, .tbl td.num { text-align: right; }
.spark-col { width: 96px; }
.tbl td { padding: 11px 14px; border-bottom: 1px solid #f1f5f9; font-size: 13.5px; color: #334155; vertical-align: middle; transition: background-color 0.5s ease; }
.tbl tbody tr:last-child td { border-bottom: none; }
.tbl tbody tr.flash-up td { background-color: rgba(34,197,94,0.14); }
.tbl tbody tr.flash-down td { background-color: rgba(239,68,68,0.14); }
.sym-name { font-weight: 700; color: #0f172a; }
.sym-full { font-size: 11px; color: #94a3b8; margin-top: 1px; }
.price-val { font-weight: 700; color: #0f172a; font-variant-numeric: tabular-nums; }
.chg-val { font-weight: 700; font-variant-numeric: tabular-nums; display: inline-flex; align-items: center; gap: 3px; justify-content: flex-end; }
.chg-val.up { color: #16a34a; }
.chg-val.down { color: #dc2626; }
.chg-arrow { font-size: 10px; }
.spark { display: block; }let ASSETS = [
{ symbol: 'BTC', name: 'Bitcoin', price: 64280.50, history: [63100, 63400, 63950, 63700, 64010, 64280] },
{ symbol: 'ETH', name: 'Ethereum', price: 3142.80, history: [3190, 3175, 3120, 3145, 3130, 3142.80] },
{ symbol: 'SOL', name: 'Solana', price: 148.62, history: [140.2, 142.8, 145.1, 146.9, 147.5, 148.62] },
{ symbol: 'AAPL', name: 'Apple Inc', price: 227.14, history: [225.6, 226.1, 226.8, 227.4, 226.9, 227.14] },
];
const basePrices = ASSETS.map(a => a.history[0]);
function pctChange(a) {
const base = basePrices[ASSETS.indexOf(a)];
return ((a.price - base) / base) * 100;
}
function sparkPoints(history) {
const w = 88, h = 26, n = history.length;
const min = Math.min(...history), max = Math.max(...history);
const range = max - min || 1;
return history.map((v, i) => {
const x = (i / (n - 1)) * w;
const y = h - ((v - min) / range) * h;
return x.toFixed(1) + ',' + y.toFixed(1);
}).join(' ');
}
function render() {
const tbody = document.getElementById('tbody');
tbody.innerHTML = ASSETS.map(a => {
const chg = pctChange(a);
const up = chg >= 0;
return `
<tr data-symbol="${a.symbol}">
<td>
<div class="sym-name">${a.symbol}</div>
<div class="sym-full">${a.name}</div>
</td>
<td class="num price-val" data-role="price">$${a.price.toLocaleString(undefined, { minimumFractionDigits: 2, maximumFractionDigits: 2 })}</td>
<td class="num">
<span class="chg-val ${up ? 'up' : 'down'}" data-role="chg">
<span class="chg-arrow">${up ? '\u25B2' : '\u25BC'}</span>${Math.abs(chg).toFixed(2)}%
</span>
</td>
<td>
<svg class="spark" width="88" height="26" viewBox="0 0 88 26">
<polyline fill="none" stroke="${up ? '#16a34a' : '#dc2626'}" stroke-width="1.8" stroke-linecap="round" stroke-linejoin="round" points="${sparkPoints(a.history)}"/>
</svg>
</td>
</tr>
`;
}).join('');
}
function updatePrices() {
ASSETS.forEach(a => {
const volatility = a.price * 0.004;
const next = Math.max(0.01, a.price + (Math.random() * 2 - 1) * volatility);
const direction = next > a.price ? 'up' : next < a.price ? 'down' : null;
a.price = Math.round(next * 100) / 100;
a.history.push(a.price);
if (a.history.length > 12) a.history.shift();
const row = document.querySelector('tr[data-symbol="' + a.symbol + '"]');
if (!row) return;
const chg = pctChange(a);
const up = chg >= 0;
row.querySelector('[data-role="price"]').textContent = '$' + a.price.toLocaleString(undefined, { minimumFractionDigits: 2, maximumFractionDigits: 2 });
const chgEl = row.querySelector('[data-role="chg"]');
chgEl.className = 'chg-val ' + (up ? 'up' : 'down');
chgEl.innerHTML = '<span class="chg-arrow">' + (up ? '\u25B2' : '\u25BC') + '</span>' + Math.abs(chg).toFixed(2) + '%';
const poly = row.querySelector('.spark polyline');
poly.setAttribute('points', sparkPoints(a.history));
poly.setAttribute('stroke', up ? '#16a34a' : '#dc2626');
if (direction) {
row.classList.remove('flash-up', 'flash-down');
void row.offsetWidth; // restart the CSS transition even if the same direction flashed last tick
row.classList.add(direction === 'up' ? 'flash-up' : 'flash-down');
setTimeout(() => row.classList.remove('flash-up', 'flash-down'), 550);
}
});
}
render();
setInterval(updatePrices, 1600);Extend with AI
Take This Snippet Further With AI
The AI prompt for this one is for Patreon supporters ($3 a month), along with a site with no ads. Supporters enter the passcode once and it is remembered in this browser.
What's included
Features
About this UI Snippet
Live Market Watchlist Table — Flash-on-Change Rows, Live Sparklines & Surgical DOM Updates
A price table that silently updates numbers in place is easy to miss changes in — a trader or investor glancing away for a few seconds has no way to tell whether a price just moved or has been sitting still the whole time. This watchlist solves that with a brief background-color flash on any row whose price just changed, colored green or red by direction, alongside a live sparkline trend line per asset that updates every tick.
Surgical per-cell updates, not a full re-render
render() builds the entire table once on load, but the repeating updatePrices() function never calls it again. Instead, it looks up each row by data-symbol, then updates exactly three things inside it directly: the price text node, the change badge's class and innerHTML, and the sparkline polyline's points and stroke attributes. This distinction is what makes the flash animation possible at all — if the whole table re-rendered from scratch every tick, any CSS transition or flash class added a moment earlier would be wiped out along with the stale DOM node it was attached to.
Restarting a CSS transition with a forced reflow
When a row's price moves in the *same* direction two ticks in a row, simply re-adding the same .flash-up class would have no visible effect — the class is already present, so no transition triggers. updatePrices() handles this by removing both flash classes, reading row.offsetWidth (a layout property read that forces the browser to flush pending style changes before continuing — a well-known technique for restarting CSS animations), and only then re-adding the appropriate flash class. Without that forced reflow, a stock moving up for three consecutive ticks would only flash on the first one.
Self-normalizing sparklines from a rolling history window
Each asset carries its own history array, capped at 12 points via .shift() once new prices push it over that length. sparkPoints() normalizes each point between that array's own current min and max, so the sparkline always uses its full available height regardless of whether the asset has been range-bound or has just had a sharp move — a fixed y-axis scale shared across all assets would flatten a low-volatility asset's line to a nearly straight one.
Percent change measured against a fixed baseline, not the previous tick
pctChange() always compares the current price to basePrices, a value captured once when the page loaded (the first entry in each asset's initial history) — not to the price one tick earlier. This mirrors how a real "24h change" figure works: it should represent total movement since a fixed reference point, not reset itself relative to whatever the price happened to be a moment ago.
Step by step
How to Use
- 1Watch it update liveEvery 1.6 seconds, prices nudge randomly — the changed price, percentage badge, and sparkline update in place, with the row briefly flashing green or red.
- 2Replace ASSETS with real symbolsSet each asset's symbol, name, starting price, and initial history array to real data from your market data provider.
- 3Connect a real price feedReplace the setInterval(updatePrices, 1600) simulation with a WebSocket or polling callback from your market data API that sets a.price directly before running the same DOM-update logic.
- 4Adjust the flash durationChange the 550 in the setTimeout call and the 0.5s in the CSS transition to make the flash linger longer or shorter.
- 5Change the sparkline history windowEdit the "if (a.history.length > 12)" check to show a longer or shorter recent trend per asset.
- 6Export in your formatClick "HTML" for a standalone file, "JSX" for a React component, or "Tailwind" for a Tailwind CSS version.
Real-world uses
Common Use Cases
Got questions?
Frequently Asked Questions
If a row's price moves in the same direction on two consecutive ticks, simply re-adding the already-present .flash-up class triggers no CSS transition, since the class never actually left. Reading row.offsetWidth forces the browser to apply the class-removal style change immediately (a technique called a forced reflow) before the class is re-added, guaranteeing the transition restarts every time.
Rebuilding the entire tbody from scratch every 1.6 seconds would destroy and recreate every row, which would immediately erase any in-progress flash CSS transition and cause needless layout work. updatePrices() instead finds each row by its data-symbol attribute and updates only the price text, change badge, and sparkline polyline points directly.
pctChange() always compares the current price to basePrices, a value captured once from each asset's initial history when the page first loaded — not the price one tick earlier. This matches how a real "24h change" figure behaves: a running total change since a fixed reference point, not something that resets relative to the last tick.
sparkPoints() normalizes each asset's own history array between that array's current minimum and maximum, so every sparkline always uses its full available height — a shared fixed scale across assets would flatten a low-volatility asset's line to nearly a straight one.
Replace the setInterval(updatePrices, 1600) simulation with a WebSocket message handler (or polling call) from your market data provider that sets each asset's price property to the real incoming value, then reuses the same DOM-update block that already exists inside updatePrices() for the flash, badge, and sparkline logic.
Each asset's history array is capped at 12 entries via a .shift() call once a new price push exceeds that length, keeping the sparkline focused on roughly the most recent 12 ticks rather than growing unbounded.