

Tabulator Grouped Rows with Aggregates — Free JS Snippet
Tabulator Grouped Rows with Aggregates · Tables · Plain HTML, CSS & JS · Live preview
What's included
Features
About this UI Snippet
Tabulator Grouped Rows with Aggregates — HTML, CSS & JavaScript
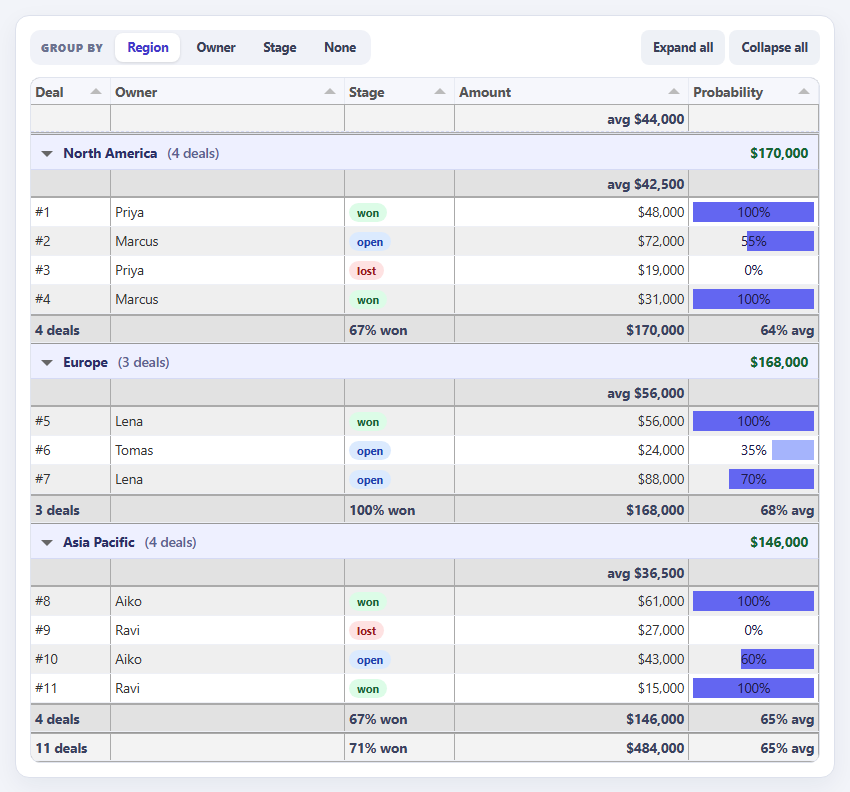
A flat list of records answers "what do we have?". A grouped view with totals answers "how are we doing?" — sales by region, tickets by owner, spend by category. That second question is why finance and operations dashboards are built around grouped tables with subtotals, and it is the shape of data that spreadsheet users already understand. Tabulator can produce it from three pieces of configuration: groupBy, a group header function and column calculations.
groupBy names the field to group on, and Tabulator builds the collapsible sections. groupStartOpen controls whether they begin expanded, and groupToggleElement: 'header' makes the entire header row clickable rather than just a small arrow — a small choice that makes folding much easier. The groupHeader function receives the group's value, its row count and the rows themselves, so it can return anything: this snippet shows the region name, the number of deals, and a right-aligned dollar total computed with a reduce over the group's data. That is why every section header tells you the answer without being expanded.
Aggregates use column calculations. Setting bottomCalc: 'sum' on the Amount column adds a total row, and topCalc: 'avg' adds an average row above. Built-in calculations include sum, avg, count, min and max. The table option columnCalcs: 'both' is the key setting: it shows the calculation rows at the table level and inside every group, so subtotals and a grand total come from one definition. Calculation output can be customised with formatters, which the snippet uses to add currency, a "deals" suffix and a "% avg" label.
The most useful trick is a custom calculation. A calc can be a function that receives the column's values and the full row data, and the winRate function uses the row data to compute the share of closed deals that were won — a figure that depends on a different column from the one it appears under. Finally, setGroupBy() changes the grouping on the fly, so the same data can be viewed by region, owner or stage, or ungrouped by passing false. The aggregates recompute automatically for whichever grouping is active.
Step by step
How to Use
- 1Read the group headersEach region shows its deal count and total value in the header, even when collapsed.
- 2Fold groupsClick a group header to collapse it, or use Expand all and Collapse all.
- 3Read the aggregate rowsInside each group, an average appears above and sum, count and win rate appear below; a grand total closes the table.
- 4RegroupSwitch Group by to Owner or Stage. Headers and aggregates recompute for the new grouping.
- 5UngroupChoose None to see the flat list again with a single table-wide total.
Real-world uses
Common Use Cases
columnCalcs: 'both' giving subtotals per group plus a grand total.Got questions?
Frequently Asked Questions
Set columnCalcs: "both" (or "group") and define topCalc or bottomCalc on the columns you want aggregated.
Tabulator includes sum, avg, count, min, max and a few others, and you can supply your own function.
Pass a function as the calc. It receives the column values, the row data and any params, and returns the value to display.
Call table.setGroupBy("field"). Pass false to remove grouping.
Provide a groupHeader function that receives the value, count, data and group, and returns an HTML string.
Loop over table.getGroups() and call hide() on each one, or show() to expand.
Yes. Use the JSX, Vue, Angular or Tailwind export buttons on this page to convert the markup and styles. The behaviour comes from Tabulator, so in a framework project install it with npm install tabulator-tables (or react-tabulator) instead of the CDN tag, create it in useEffect / onMounted / ngAfterViewInit and wait for the tableBuilt event, and release it with destroy() when the component unmounts.
Build with AI
Build, Understand, Optimize, and Extend It With AI
Ask an AI assistant like Claude to add multi-level grouping by region then stage, conditional colouring of over-quota groups, or CSV export of the aggregates.
Prompt to recreate it
Copy this into your AI assistant of choice to build the effect from scratch, or as a jumping-off point for your own variant:
Build a grouped sales grid with Tabulator 6 loaded from a CDN (script and CSS).

Requirements:
- Use eleven deals with region, owner, stage (won/open/lost), amount and probability; set groupBy 'region', groupStartOpen, groupToggleElement 'header' and columnCalcs 'both'.
- Write a groupHeader function that returns the region, the deal count and the summed amount.
- Add column calculations: count on the ID column, sum (bottom) and avg (top) on amount with formatted output, avg on probability, and a custom function calc on stage returning the win rate of closed deals from the row data.
- Show probability with the progress formatter and stage as a coloured pill.
- Add buttons that call table.setGroupBy() for region, owner, stage and false, plus Expand all and Collapse all using getGroups().
Want to tighten it up first? Run this prompt through the AI Prompt Studio to score it across 8 quality dimensions, catch anti-patterns, and tune the wording for Claude, ChatGPT, or Gemini before you paste it in.
Source Code
<div class="tq-card">
  <div class="tq-bar">
    <div class="tq-group" role="group" aria-label="Group by">
      <span>Group by</span>
      <button type="button" data-g="region" class="on">Region</button>
      <button type="button" data-g="owner">Owner</button>
      <button type="button" data-g="stage">Stage</button>
      <button type="button" data-g="">None</button>
    </div>
    <div class="tq-expand">
      <button type="button" id="tqOpen">Expand all</button>
      <button type="button" id="tqClose">Collapse all</button>
    </div>
  </div>
  <div id="tqTable"></div>
</div>
body { background: #f2f4f9; padding: 18px; font-family: system-ui, sans-serif; }
.tq-card { max-width: 820px; margin: 0 auto; background: #fff; border: 1px solid #dde1ec; border-radius: 14px; padding: 14px; box-shadow: 0 8px 24px rgba(20,30,70,.06); }
.tq-bar { display: flex; justify-content: space-between; gap: 10px; margin-bottom: 12px; flex-wrap: wrap; }
.tq-group { display: flex; align-items: center; gap: 4px; background: #f0f2f8; padding: 3px; border-radius: 10px; }
.tq-group span { font: 800 11px/1 system-ui, sans-serif; letter-spacing: .06em; text-transform: uppercase; color: #6b7290; padding: 0 8px; }
.tq-group button, .tq-expand button { font: 700 12.5px/1 system-ui, sans-serif; color: #384057; background: none; border: 0; border-radius: 8px; padding: 8px 12px; cursor: pointer; }
.tq-group button.on { background: #fff; color: #4338ca; box-shadow: 0 1px 3px rgba(0,0,0,.12); }
.tq-expand { display: flex; gap: 4px; }
.tq-expand button { background: #eef1f6; }
.tq-expand button:hover { background: #e0e5ee; }
.tabulator { border: 1px solid #e0e4ee; border-radius: 10px; font-size: 13.5px; }
.tabulator .tabulator-header { background: #f6f7fc; border-bottom: 1px solid #e0e4ee; }
.tabulator .tabulator-header .tabulator-col { background: #f6f7fc; border-right: 1px solid #e8ebf3; }
.tabulator-row { border-bottom: 1px solid #eef0f6; }
.tabulator-row.tabulator-group { background: #eef0ff; border-bottom: 1px solid #d5daf5; color: #2b2f66; font-weight: 700; padding: 8px 10px; }
.tabulator-row.tabulator-group span.g-meta { margin-left: 10px; font-weight: 600; color: #5b628f; }
.tabulator-row.tabulator-group span.g-total { float: right; color: #166534; }
.tabulator-row.tabulator-calcs { background: #fafbff; font-weight: 700; color: #3a4260; }
.tabulator-row.tabulator-calcs.tabulator-calcs-top { border-bottom: 1px dashed #d5daf5; }
.pill { display: inline-block; font: 700 11px/1 system-ui, sans-serif; padding: 4px 8px; border-radius: 999px; }
.pill.won { background: #dcfce7; color: #166534; } .pill.lost { background: #fee2e2; color: #991b1b; } .pill.open { background: #dbeafe; color: #1e40af; }const deals = [
{ id: 1, region: 'North America', owner: 'Priya', stage: 'won', amount: 48000, prob: 100 },
{ id: 2, region: 'North America', owner: 'Marcus', stage: 'open', amount: 72000, prob: 55 },
{ id: 3, region: 'North America', owner: 'Priya', stage: 'lost', amount: 19000, prob: 0 },
{ id: 4, region: 'North America', owner: 'Marcus', stage: 'won', amount: 31000, prob: 100 },
{ id: 5, region: 'Europe', owner: 'Lena', stage: 'won', amount: 56000, prob: 100 },
{ id: 6, region: 'Europe', owner: 'Tomas', stage: 'open', amount: 24000, prob: 35 },
{ id: 7, region: 'Europe', owner: 'Lena', stage: 'open', amount: 88000, prob: 70 },
{ id: 8, region: 'Asia Pacific', owner: 'Aiko', stage: 'won', amount: 61000, prob: 100 },
{ id: 9, region: 'Asia Pacific', owner: 'Ravi', stage: 'lost', amount: 27000, prob: 0 },
{ id: 10, region: 'Asia Pacific', owner: 'Aiko', stage: 'open', amount: 43000, prob: 60 },
{ id: 11, region: 'Asia Pacific', owner: 'Ravi', stage: 'won', amount: 15000, prob: 100 },
];
const money = function (v) { return '$' + Math.round(v).toLocaleString('en-US'); };
// Custom aggregate: share of closed deals that were won. Calc functions receive the column values and full row data.
function winRate(values, rowData) {
const closed = rowData.filter(function (d) { return d.stage !== 'open'; });
if (!closed.length) return '-';
return Math.round(closed.filter(function (d) { return d.stage === 'won'; }).length / closed.length * 100) + '% won';
}
const table = new Tabulator('#tqTable', {
data: deals,
layout: 'fitColumns',
groupBy: 'region',
groupStartOpen: true,
groupToggleElement: 'header', // click anywhere on the group header to fold it
columnCalcs: 'both', // aggregate rows at the top AND bottom of every group (and the table)
groupHeader: function (value, count, data) {
const total = data.reduce(function (s, d) { return s + d.amount; }, 0);
return value + '<span class="g-meta">(' + count + ' deal' + (count > 1 ? 's' : '') + ')</span><span class="g-total">' + money(total) + '</span>';
},
columns: [
{ title: 'Deal', field: 'id', width: 80, formatter: function (c) { return '#' + c.getValue(); }, bottomCalc: 'count', bottomCalcFormatter: function (c) { return c.getValue() + ' deals'; } },
{ title: 'Owner', field: 'owner', minWidth: 110 },
{ title: 'Stage', field: 'stage', width: 110, formatter: function (c) { const v = c.getValue(); return '<span class="pill ' + v + '">' + v + '</span>'; }, bottomCalc: winRate },
{ title: 'Amount', field: 'amount', hozAlign: 'right', sorter: 'number', formatter: function (c) { return money(c.getValue()); },
bottomCalc: 'sum', bottomCalcFormatter: function (c) { return money(c.getValue()); },
topCalc: 'avg', topCalcFormatter: function (c) { return 'avg ' + money(c.getValue()); } },
{ title: 'Probability', field: 'prob', width: 130, hozAlign: 'right', formatter: 'progress', formatterParams: { min: 0, max: 100, color: ['#a5b4fc', '#6366f1'], legend: function (v) { return v + '%'; }, legendColor: '#1e1b4b' },
bottomCalc: 'avg', bottomCalcFormatter: function (c) { return Math.round(c.getValue()) + '% avg'; } },
],
});
// Re-group without rebuilding the table. Passing false ungroups.
const btns = document.querySelectorAll('.tq-group button');
btns.forEach(function (b) {
b.addEventListener('click', function () {
btns.forEach(function (x) { x.classList.toggle('on', x === b); });
table.setGroupBy(b.dataset.g || false);
});
});
document.getElementById('tqOpen').addEventListener('click', function () { table.getGroups().forEach(function (g) { g.show(); }); });
document.getElementById('tqClose').addEventListener('click', function () { table.getGroups().forEach(function (g) { g.hide(); }); });