



Table with Scroll Shadow Indicators — Free HTML CSS JS Snippet
Table with Scroll Shadow Indicators · Tables · Plain HTML, CSS & JS · Live preview
Copy & paste
Source Code
<div class="wrap">
  <div class="table-head">
    <h2 class="table-title">Quarterly Revenue by Region</h2>
    <span class="hint" id="hint">Scroll to see more columns →</span>
  </div>
  <div class="table-scroll" id="scrollArea">
    <div class="shadow-left" id="shadowLeft"></div>
    <div class="shadow-right" id="shadowRight"></div>
    <table class="tbl">
      <thead>
        <tr>
          <th class="pin-col">Region</th>
          <th>Q1 2024</th>
          <th>Q2 2024</th>
          <th>Q3 2024</th>
          <th>Q4 2024</th>
          <th>Q1 2025</th>
          <th>Q2 2025</th>
          <th>Q3 2025</th>
          <th>Q4 2025</th>
          <th>YoY growth</th>
        </tr>
      </thead>
      <tbody id="tbody"></tbody>
    </table>
  </div>
</div>
* { box-sizing: border-box; margin: 0; padding: 0; }
body { font-family: system-ui, sans-serif; background: #f8fafc; min-height: 100vh; padding: 32px 20px; }
.wrap { max-width: 720px; margin: 0 auto; }
.table-head { display: flex; align-items: center; justify-content: space-between; margin-bottom: 12px; gap: 12px; }
.table-title { font-size: 17px; font-weight: 800; color: #0f172a; }
.hint { font-size: 11.5px; color: #94a3b8; font-weight: 600; white-space: nowrap; transition: opacity 0.3s; }
.hint.hidden { opacity: 0; }
.table-scroll { position: relative; overflow-x: auto; border-radius: 12px; box-shadow: 0 1px 6px rgba(0,0,0,0.06); }
.tbl { width: 100%; min-width: 900px; border-collapse: collapse; background: #fff; }
.tbl thead tr { background: #f8fafc; }
.tbl th { padding: 11px 16px; text-align: right; font-size: 11px; font-weight: 700; text-transform: uppercase; letter-spacing: 0.4px; color: #64748b; border-bottom: 1px solid #e2e8f0; white-space: nowrap; }
.tbl th.pin-col, .tbl td.pin-col { text-align: left; position: sticky; left: 0; background: #f8fafc; z-index: 2; }
.tbl td.pin-col { background: #fff; font-weight: 700; color: #0f172a; }
.tbl td { padding: 11px 16px; text-align: right; border-bottom: 1px solid #f1f5f9; font-size: 13px; color: #334155; font-variant-numeric: tabular-nums; white-space: nowrap; }
.tbl tbody tr:last-child td { border-bottom: none; }
.tbl tbody tr:hover td:not(.pin-col) { background: #fafafa; }
.tbl tbody tr:hover td.pin-col { background: #f8fafc; }
.growth-val { font-weight: 700; }
.growth-val.pos { color: #16a34a; }
.growth-val.neg { color: #dc2626; }
.shadow-left, .shadow-right { position: absolute; top: 0; bottom: 0; width: 28px; pointer-events: none; opacity: 0; transition: opacity 0.2s ease; z-index: 3; }
.shadow-left { left: 0; background: linear-gradient(90deg, rgba(15,23,42,0.14), transparent); }
.shadow-right { right: 0; background: linear-gradient(-90deg, rgba(15,23,42,0.14), transparent); }
.shadow-left.visible, .shadow-right.visible { opacity: 1; }const REGIONS = [
{ name: 'North America', values: [4.2, 4.5, 4.4, 4.9, 4.8, 5.1, 5.3, 5.7], growth: 16.3 },
{ name: 'EMEA', values: [3.1, 3.0, 3.3, 3.6, 3.5, 3.4, 3.6, 3.9], growth: 8.3 },
{ name: 'APAC', values: [2.4, 2.6, 2.9, 3.1, 3.4, 3.8, 4.1, 4.6], growth: 48.4 },
{ name: 'Latin America', values: [1.1, 1.0, 1.2, 1.3, 1.2, 1.1, 1.3, 1.4], growth: 7.7 },
{ name: 'Rest of World', values: [0.6, 0.7, 0.7, 0.8, 0.9, 0.9, 1.0, 1.1], growth: 22.2 },
];
function render() {
document.getElementById('tbody').innerHTML = REGIONS.map(r => {
const cells = r.values.map(v => '<td>$' + v.toFixed(1) + 'M</td>').join('');
const up = r.growth >= 0;
return '<tr>' +
'<td class="pin-col">' + r.name + '</td>' +
cells +
'<td><span class="growth-val ' + (up ? 'pos' : 'neg') + '">' + (up ? '+' : '') + r.growth.toFixed(1) + '%</span></td>' +
'</tr>';
}).join('');
}
function updateShadows() {
const el = document.getElementById('scrollArea');
const maxScroll = el.scrollWidth - el.clientWidth;
const atStart = el.scrollLeft <= 2;
const atEnd = el.scrollLeft >= maxScroll - 2;
document.getElementById('shadowLeft').classList.toggle('visible', !atStart);
document.getElementById('shadowRight').classList.toggle('visible', !atEnd && maxScroll > 0);
const hint = document.getElementById('hint');
if (el.scrollLeft > 4) hint.classList.add('hidden');
}
const scrollArea = document.getElementById('scrollArea');
render();
updateShadows();
scrollArea.addEventListener('scroll', updateShadows, { passive: true });
window.addEventListener('resize', updateShadows);Extend with AI
Take This Snippet Further With AI
The AI prompt for this one is for Patreon supporters ($3 a month, 7 days free), along with a site with no ads. Supporters enter the passcode once and it is remembered in this browser.
What's included
Features
About this UI Snippet
Table with Scroll Shadow Indicators — Sticky Row Labels & Direction-Aware Edge Fades
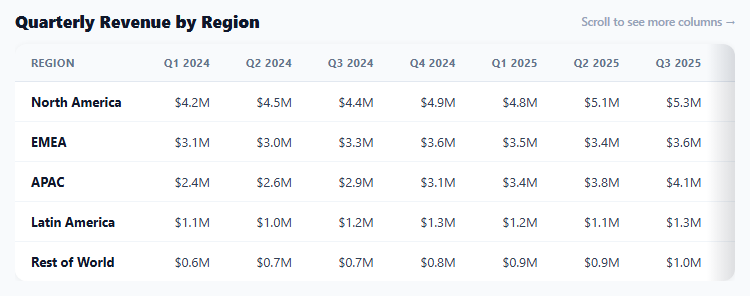
A wide table that simply gets clipped by its container gives no visual hint that there's more to see off to the side — a user has to accidentally discover horizontal scrolling exists. This snippet solves that with two things working together: a sticky first column so row labels stay readable no matter how far the table is scrolled, and a pair of subtle edge-fade shadows that appear and disappear based on actual scroll position, telling the user exactly which direction still has more content.
Shadows reflect real scroll state, not a static hint
updateShadows() runs on every scroll event (and on load, and on resize) and computes atStart/atEnd by comparing el.scrollLeft against 0 and against el.scrollWidth - el.clientWidth (the maximum possible scroll offset). The left shadow's .visible class is toggled to exactly !atStart, and the right shadow's to !atEnd — so at the very start of the table, only the right shadow shows (there's more to the right, nothing to the left); scrolled to the middle, both shadows show; scrolled fully right, only the left shadow shows. A shadow that stayed visible on both sides regardless of actual position would be actively misleading rather than helpful.
A tiny threshold, not an exact zero comparison
The atStart/atEnd checks use <= 2 and >= maxScroll - 2 rather than comparing to exactly 0 or maxScroll. Sub-pixel rounding in how browsers report scrollLeft on high-density displays or with certain zoom levels can leave a value like 0.4 instead of a clean 0 — a strict equality check would then leave a shadow incorrectly visible at the true edge. The small tolerance absorbs that rounding noise.
Sticky first column via position: sticky, not JS positioning
The .pin-col cells use position: sticky; left: 0 — a pure-CSS technique that keeps the region-name column pinned to the left edge of the scrollable container while every other column scrolls beneath it, with no JavaScript needed to reposition anything on scroll. An explicit background on the pinned cells (matching the row's hover or default state) is required so the scrolling columns behind it don't visually bleed through as they pass underneath.
The one-time hint that gets out of the way
A small "Scroll to see more columns →" hint appears next to the table title on load and fades out the first time scrollLeft moves past a few pixels — a nudge for users who might not notice the shadow alone on first glance, without persisting as visual clutter once the user has already discovered they can scroll.
Step by step
How to Use
- 1Scroll the table horizontallyShadows fade in on whichever side still has more content, and fade out once you reach that edge — try scrolling all the way right, then back.
- 2Notice the sticky first columnThe Region column stays pinned to the left as you scroll, so row labels are never lost off-screen.
- 3Resize the browser windowThe shadow visibility recalculates automatically on resize in case the table's scrollability changes.
- 4Replace REGIONS with real dataUpdate the array with your own row labels, column values, and growth figures — extra columns work automatically since cells are generated from r.values.
- 5Adjust the shadow width or intensityEdit the width and background gradient opacity on .shadow-left / .shadow-right in the CSS panel.
- 6Export in your formatClick "HTML" for a standalone file, "JSX" for a React component, or "Tailwind" for a Tailwind CSS version.
Real-world uses
Common Use Cases
Got questions?
Frequently Asked Questions
updateShadows() compares el.scrollLeft to 0 (the start) and to el.scrollWidth minus el.clientWidth (the maximum scrollable offset, the end). The left shadow becomes visible whenever the table is not at the start, and the right shadow whenever it is not at the end — so the shadows always reflect exactly how much scrollable content remains on each side.
Browsers can report scrollLeft as a non-integer value (like 0.4px) due to sub-pixel rendering, especially on high-density displays or certain zoom levels. A strict === 0 check could then fail to detect the true start position, leaving the left shadow incorrectly visible. The small numeric tolerance (<= 2) absorbs that rounding noise reliably.
The .pin-col cells use the CSS position: sticky with left: 0, which keeps them pinned to the left edge of their nearest scrolling ancestor (the .table-scroll container) as the user scrolls horizontally. An explicit background color is set on those cells specifically so the other columns do not show through as they scroll underneath the pinned column.
Yes — a window resize event listener also calls updateShadows(), since resizing can change whether the table even has overflow at all (a table that fit inside a wide viewport with no shadows might suddenly need them once the viewport narrows).
Add more numbers to each region's values array and a matching <th> header cell in the HTML — the row-rendering code maps over r.values to generate one <td> per entry automatically, so no other JavaScript changes are needed for additional columns.
Yes — the scroll-shadow logic in updateShadows() is entirely independent of the sticky column CSS. Remove the position: sticky rules from .pin-col if you only want the fading edge-shadow scroll indicator without a pinned column.