
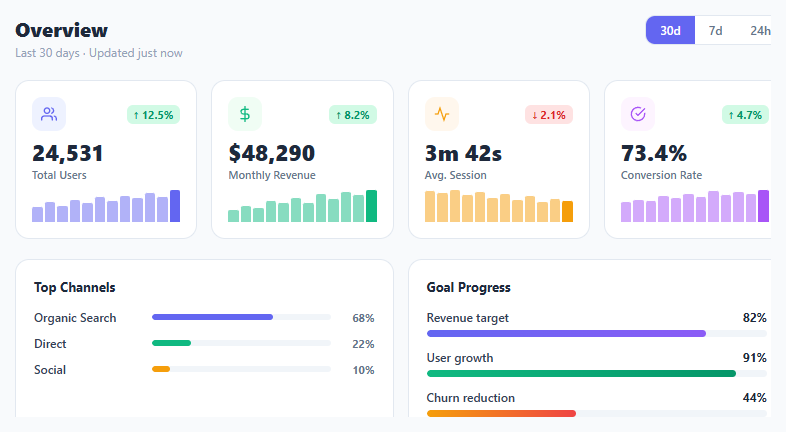
Metric KPI Card Grid

Interact.js Draggable and Resizable Dashboard Panels with Snapping
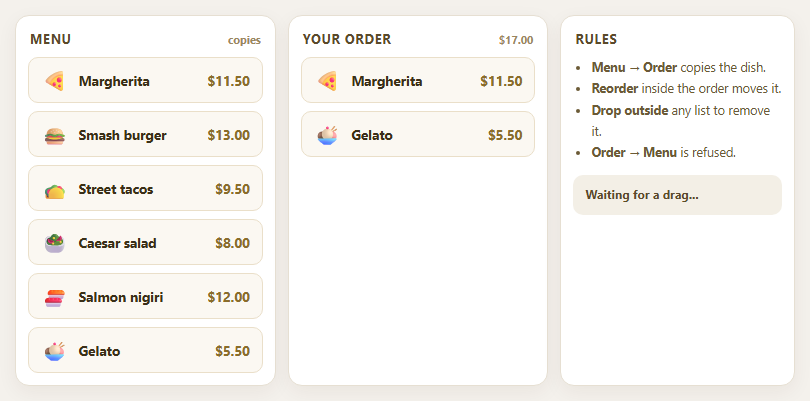
Dragula Copy vs Move Lists with Spill Control

SortableJS Shared Groups: Clone from a Palette into a Page Builder

SortableJS Drag Handle with Pinned and Locked Rows
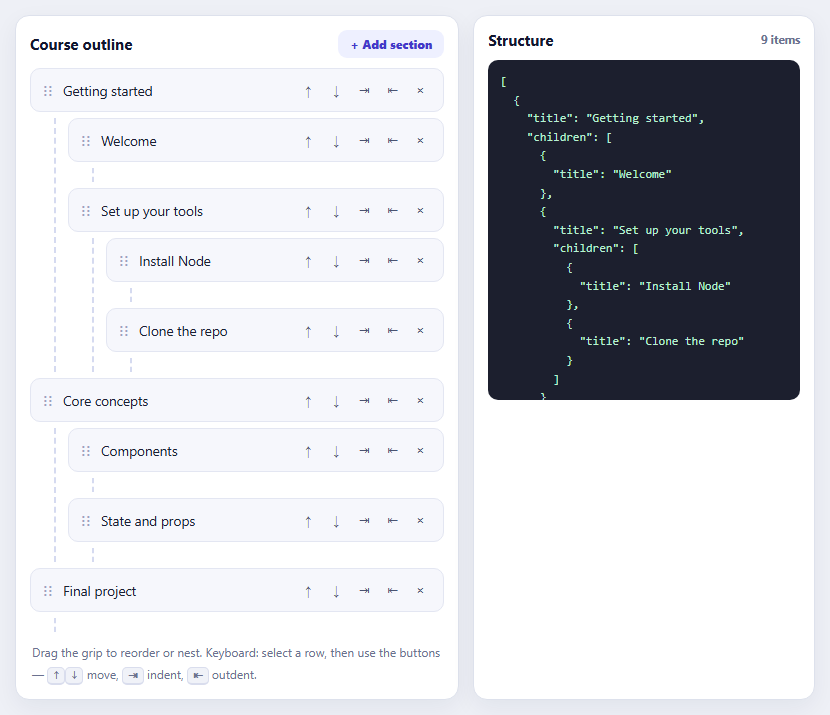
SortableJS Nested Sortable Tree with Keyboard Controls
Transaction List — Free HTML CSS JS Snippet
Transaction List · Dashboards · Plain HTML, CSS & JS · Live preview
Copy & paste
Source Code
<div class="txl">
  <div class="txl-head">
    <h3>Transactions</h3>
    <div class="txl-tabs" id="txlTabs">
      <button class="active" data-f="all" type="button">All</button>
      <button data-f="in" type="button">Income</button>
      <button data-f="out" type="button">Spending</button>
    </div>
  </div>
  <div class="txl-list" id="txlList"></div>
</div>
* { box-sizing: border-box; margin: 0; padding: 0; }
body { font-family: system-ui, -apple-system, sans-serif; background: #f1f5f9; min-height: 100vh; display: flex; align-items: center; justify-content: center; padding: 24px; }
.txl { width: min(420px, 100%); background: #fff; border: 1px solid #e2e8f0; border-radius: 18px; box-shadow: 0 10px 30px rgba(15, 23, 42, 0.08); overflow: hidden; }
.txl-head { display: flex; align-items: center; justify-content: space-between; gap: 10px; padding: 16px 18px 12px; }
.txl-head h3 { font-size: 16px; font-weight: 800; color: #0f172a; }
.txl-tabs { display: flex; gap: 4px; padding: 3px; background: #f1f5f9; border-radius: 999px; }
.txl-tabs button {
padding: 5px 12px; border: none; border-radius: 999px; background: none; cursor: pointer;
font-family: inherit; font-size: 12px; font-weight: 600; color: #64748b; transition: all 0.2s;
}
.txl-tabs button.active { background: #fff; color: #0f172a; box-shadow: 0 1px 4px rgba(15, 23, 42, 0.12); }
.txl-list { max-height: 380px; overflow-y: auto; padding: 0 10px 12px; }
.txl-date {
position: sticky; top: 0; z-index: 1;
padding: 8px 8px 6px; background: #fff;
font-size: 11px; font-weight: 700; text-transform: uppercase; letter-spacing: 0.06em; color: #94a3b8;
}
.txl-date span { float: right; font-weight: 600; text-transform: none; letter-spacing: 0; }
.txl-row {
display: flex; align-items: center; gap: 12px;
padding: 10px 8px; border-radius: 12px; cursor: pointer;
animation: txlIn 0.3s ease both;
transition: background 0.15s;
}
.txl-row:hover { background: #f8fafc; }
@keyframes txlIn { from { opacity: 0; transform: translateY(6px); } to { opacity: 1; transform: none; } }
.txl-ico {
width: 40px; height: 40px; border-radius: 12px; flex-shrink: 0;
display: flex; align-items: center; justify-content: center;
}
.txl-ico svg { width: 18px; height: 18px; fill: none; stroke-width: 2; stroke-linecap: round; stroke-linejoin: round; }
.txl-main { flex: 1; min-width: 0; }
.txl-main strong { display: block; font-size: 13.5px; font-weight: 600; color: #0f172a; white-space: nowrap; overflow: hidden; text-overflow: ellipsis; }
.txl-main small { font-size: 11.5px; color: #94a3b8; }
.txl-amt { font-size: 13.5px; font-weight: 700; color: #0f172a; font-variant-numeric: tabular-nums; }
.txl-amt.in { color: #059669; }
.txl-empty { padding: 32px 0; text-align: center; font-size: 13px; color: #94a3b8; }const TXNS = [
{ day: 'Today', time: '14:32', name: 'Salary — Acme Corp', cat: 'Income', amount: 4200.00, icon: 'bank', tint: '#dcfce7', stroke: '#059669' },
{ day: 'Today', time: '09:18', name: 'Blue Bottle Coffee', cat: 'Food & drink', amount: -6.40, icon: 'coffee', tint: '#fef3c7', stroke: '#d97706' },
{ day: 'Yesterday', time: '19:47', name: 'Whole Foods Market', cat: 'Groceries', amount: -84.12, icon: 'cart', tint: '#dbeafe', stroke: '#2563eb' },
{ day: 'Yesterday', time: '16:05', name: 'Refund — Nike Store', cat: 'Refund', amount: 129.99, icon: 'undo', tint: '#dcfce7', stroke: '#059669' },
{ day: 'Yesterday', time: '08:30', name: 'Uber Ride', cat: 'Transport', amount: -14.75, icon: 'car', tint: '#ede9fe', stroke: '#7c3aed' },
{ day: 'Jun 30', time: '21:12', name: 'Netflix', cat: 'Subscription', amount: -15.99, icon: 'play', tint: '#fee2e2', stroke: '#dc2626' },
{ day: 'Jun 30', time: '12:44', name: 'Freelance invoice #42',cat: 'Income', amount: 850.00, icon: 'bank', tint: '#dcfce7', stroke: '#059669' },
{ day: 'Jun 30', time: '10:02', name: 'Shell Gas Station', cat: 'Transport', amount: -52.30, icon: 'car', tint: '#ede9fe', stroke: '#7c3aed' },
];
const ICONS = {
bank: '<svg viewBox="0 0 24 24"><path d="M3 21h18M3 10h18M5 6l7-3 7 3M4 10v11M20 10v11M8 14v3M12 14v3M16 14v3"/></svg>',
coffee: '<svg viewBox="0 0 24 24"><path d="M18 8h1a4 4 0 0 1 0 8h-1M2 8h16v9a4 4 0 0 1-4 4H6a4 4 0 0 1-4-4V8zM6 1v3M10 1v3M14 1v3"/></svg>',
cart: '<svg viewBox="0 0 24 24"><circle cx="9" cy="21" r="1"/><circle cx="20" cy="21" r="1"/><path d="M1 1h4l2.68 13.39a2 2 0 0 0 2 1.61h9.72a2 2 0 0 0 2-1.61L23 6H6"/></svg>',
undo: '<svg viewBox="0 0 24 24"><polyline points="1 4 1 10 7 10"/><path d="M3.51 15a9 9 0 1 0 2.13-9.36L1 10"/></svg>',
car: '<svg viewBox="0 0 24 24"><path d="M5 17h14M6 11l1.5-5h9L18 11M4 17a1 1 0 0 0 1 1h1a1 1 0 0 0 1-1v-1h10v1a1 1 0 0 0 1 1h1a1 1 0 0 0 1-1v-5l-2-1H5l-2 1v5z"/></svg>',
play: '<svg viewBox="0 0 24 24"><circle cx="12" cy="12" r="10"/><polygon points="10 8 16 12 10 16 10 8"/></svg>',
};
const list = document.getElementById('txlList');
const tabs = document.getElementById('txlTabs');
const fmt = new Intl.NumberFormat('en-US', { style: 'currency', currency: 'USD' });
function render(filter) {
const rows = TXNS.filter(t =>
filter === 'in' ? t.amount > 0 : filter === 'out' ? t.amount < 0 : true
);
if (!rows.length) {
list.innerHTML = '<div class="txl-empty">No transactions match this filter.</div>';
return;
}
// Group into day buckets, preserving order, and compute a per-day net total
const days = [];
rows.forEach(t => {
let bucket = days[days.length - 1];
if (!bucket || bucket.day !== t.day) { bucket = { day: t.day, items: [], net: 0 }; days.push(bucket); }
bucket.items.push(t);
bucket.net += t.amount;
});
let html = '';
let idx = 0;
days.forEach(d => {
const sign = d.net > 0 ? '+' : '';
html += '<div class="txl-date">' + d.day + '<span>' + sign + fmt.format(d.net) + '</span></div>';
d.items.forEach(t => {
html += '<div class="txl-row" style="animation-delay:' + (idx++ * 40) + 'ms">'
+ '<div class="txl-ico" style="background:' + t.tint + ';">'
+ ICONS[t.icon].replace('<svg', '<svg style="stroke:' + t.stroke + '"') + '</div>'
+ '<div class="txl-main"><strong>' + t.name + '</strong><small>' + t.cat + ' · ' + t.time + '</small></div>'
+ '<span class="txl-amt' + (t.amount > 0 ? ' in' : '') + '">'
+ (t.amount > 0 ? '+' : '') + fmt.format(t.amount) + '</span>'
+ '</div>';
});
});
list.innerHTML = html;
}
tabs.addEventListener('click', (e) => {
const btn = e.target.closest('button');
if (!btn) return;
tabs.querySelectorAll('button').forEach(b => b.classList.toggle('active', b === btn));
render(btn.dataset.f);
});
render('all');Extend with AI
Take This Snippet Further With AI
The AI prompt for this one is for Patreon supporters ($3 a month), along with a site with no ads. Supporters enter the passcode once and it is remembered in this browser.
What's included
Features
About this UI Snippet
Transaction List — Banking-App Transaction History with Day Grouping and Filters
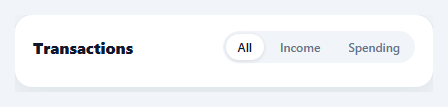
The grouped transaction list is the core screen of every banking and fintech app — Revolut, Monzo, Cash App, and every neobank render payments the same way: rows with a category icon, merchant name, and signed amount, bucketed under sticky date headers with a per-day total. This component builds that exact pattern in HTML, CSS, and vanilla JavaScript, with income/spending filter tabs, correct currency formatting via Intl.NumberFormat, and staggered entry animations.
Grouping rows into day buckets
The data is a flat TXNS array; render() folds it into day buckets in a single pass. It walks the filtered rows in order and either appends to the current bucket or starts a new one when the day changes, accumulating a running net total per bucket as it goes. Because the grouping happens at render time rather than in the data, the same array can be re-filtered (all / income / spending) and regrouped instantly — the day headers and their net totals always reflect exactly the rows on screen, so switching to "Spending" shows each day's total outflow rather than the mixed net.
Sticky date headers
Each day header uses position: sticky; top: 0 inside the scrollable list, so as you scroll, the current day's label pins to the top and is pushed away by the next one — the signature interaction of mobile banking feeds. The header carries the day's net total right-aligned, formatted with a leading + when positive. Sticky positioning needs an opaque background (#fff here) or rows would show through while pinned.
Real currency formatting
Amounts never go through manual string concatenation. new Intl.NumberFormat('en-US', { style: 'currency', currency: 'USD' }) handles the dollar sign, thousands separators, two-decimal padding, and — crucially — negative formatting, so -84.12 renders as -$84.12 without sign-juggling code. Change two constructor arguments to localise the whole list to EUR, GBP, or INR. The amounts also set font-variant-numeric: tabular-nums so digits align vertically down the column, which matters as soon as two rows sit next to each other.
Category icons without an icon font
Each transaction names an icon key, a pastel tint for the 40px rounded square, and a stroke colour, and the ICONS map holds six inline SVGs (bank, coffee, cart, refund, car, subscription). Inline SVG keeps the snippet dependency-free and lets the stroke colour be injected per transaction, so income rows read green and each spending category gets its own hue — the visual scanning aid that makes these lists parseable at a glance.
Filter tabs and the empty state
The pill tabs write a filter key (all, in, out) and re-render; filtering is a one-line predicate on the sign of amount. If a filter produces no rows the list renders an explicit empty-state message instead of a blank area — a small detail that separates production UI from demos. Rows animate in with a 40ms staggered translateY fade (the same cascade technique as the animated list), so every filter switch feels responsive rather than jarring.
Customisation
Feed TXNS from your API (map day from a date formatter like Intl.DateTimeFormat with relative labels for today/yesterday), extend ICONS with your categories, and adjust the max-height to fit your layout. Clicking a row is already wired as a pointer target — attach a handler to open a detail sheet or a bottom sheet with the full transaction.
Step by step
How to Use
- 1Paste the HTML, CSS, and JSA card renders with eight transactions grouped under Today, Yesterday, and Jun 30, each day header showing its net total on the right.
- 2Scroll the listDate headers stick to the top of the scroll area and hand off to the next day's header — the classic banking-feed interaction.
- 3Switch filter tabsClick Income or Spending — the list regroups instantly, day totals recompute for the visible rows, and rows cascade back in with a stagger.
- 4Check the empty stateFilters that match nothing show a "No transactions" message instead of a blank panel.
- 5Swap in your dataReplace the TXNS array with API data — name, category, time, signed amount, and an icon key per row; add categories to the ICONS map.
- 6Localise the currencyChange the Intl.NumberFormat locale and currency arguments to render EUR, GBP, INR, or any other currency correctly.
Real-world uses
Common Use Cases
Got questions?
Frequently Asked Questions
render() walks the filtered array in order and starts a new bucket whenever the day field changes, pushing rows into the current bucket and adding each amount to that bucket's net. Grouping at render time (instead of storing pre-grouped data) means the same flat array serves every filter — switch to Spending and the buckets and totals are rebuilt for just the negative rows in one pass.
A sticky element stays in the document flow, so rows scroll underneath it while it is pinned. Without an opaque background the pinned header would visually overlap the row text sliding beneath it. Setting background: #fff (matching the card) plus a z-index makes the hand-off clean — the next day's header pushes the previous one out of view, which is the behaviour users know from banking apps.
Map your API timestamps through a labeller before rendering: compare each date to the current day and emit "Today"/"Yesterday" for the last 48 hours, otherwise format with Intl.DateTimeFormat (for example { month: 'short', day: 'numeric' } gives "Jun 30"). Because grouping only compares consecutive day strings, any labelling scheme works as long as rows arrive sorted newest-first.
Edit the one Intl.NumberFormat line: new Intl.NumberFormat('de-DE', { style: 'currency', currency: 'EUR' }) renders 1.234,56 € with German separators; 'en-IN' with INR gives ₹ and lakh/crore grouping. Every amount in rows and day headers flows through this single formatter, so there is exactly one place to localise — never concatenate currency symbols manually.
Keep the transactions array and active filter in state, compute the day buckets with the same fold inside a useMemo / computed / getter, and render nested maps (days → rows) instead of innerHTML strings. The filter tabs become buttons that set state. Sticky headers, tabular-nums, and the stagger animation are pure CSS and port unchanged; set each row's animationDelay inline from its index.