

Chart.js Gradient Revenue Chart — Animated Area Chart
Chart.js Gradient Revenue Chart · Charts · Plain HTML, CSS & JS · Live preview
Copy & paste
Source Code
<div class="crc-card">
  <div class="crc-top">
    <div>
      <span class="crc-tag">chart.js · scriptable gradient</span>
      <h2>Revenue</h2>
      <div class="crc-figure"><b id="crcTotal">$0</b><span class="crc-delta" id="crcDelta">+0%</span></div>
    </div>
    <div class="crc-ranges" id="crcRanges">
      <button class="crc-chip" data-range="6">6M</button>
      <button class="crc-chip is-on" data-range="12">12M</button>
    </div>
  </div>

  <div class="crc-canvas"><canvas id="crcChart"></canvas></div>

  <button class="crc-add" id="crcAdd">Add this month</button>
</div>*{box-sizing:border-box;margin:0;padding:0}
body{font-family:system-ui,-apple-system,sans-serif;background:#0a0d1c;color:#fff;min-height:100vh;display:flex;align-items:center;justify-content:center;padding:26px}
.crc-card{width:min(620px,95vw);background:#111528;border:1px solid rgba(255,255,255,.09);border-radius:20px;padding:24px;box-shadow:0 30px 70px -34px rgba(0,0,0,.95)}
.crc-top{display:flex;align-items:flex-start;justify-content:space-between;gap:16px;margin-bottom:18px;flex-wrap:wrap}
.crc-tag{display:inline-block;font-size:10px;font-weight:700;letter-spacing:.14em;text-transform:uppercase;color:#5eead4;background:rgba(94,234,212,.11);border:1px solid rgba(94,234,212,.28);padding:4px 10px;border-radius:99px;margin-bottom:10px}
.crc-top h2{font-size:15px;font-weight:600;color:#98a2c0}
.crc-figure{display:flex;align-items:baseline;gap:10px;margin-top:4px}
.crc-figure b{font-size:32px;font-weight:800;letter-spacing:-.025em;font-variant-numeric:tabular-nums}
.crc-delta{font-size:12.5px;font-weight:700;color:#34d399;background:rgba(52,211,153,.12);border:1px solid rgba(52,211,153,.3);padding:3px 9px;border-radius:99px}
.crc-delta.down{color:#fb7185;background:rgba(251,113,133,.12);border-color:rgba(251,113,133,.3)}
.crc-ranges{display:flex;gap:6px;background:rgba(255,255,255,.05);border:1px solid rgba(255,255,255,.09);border-radius:11px;padding:4px}
.crc-chip{padding:7px 14px;border:none;border-radius:8px;background:transparent;color:#8f9ab8;font:600 12.5px system-ui;cursor:pointer;transition:background .16s,color .16s}
.crc-chip.is-on{background:rgba(94,234,212,.16);color:#a7f3e5}
.crc-canvas{height:260px;position:relative}
.crc-add{width:100%;margin-top:18px;padding:12px;border-radius:12px;border:1px solid rgba(255,255,255,.14);background:rgba(255,255,255,.05);color:#dbe3fb;font:600 13px system-ui;cursor:pointer;transition:background .16s}
.crc-add:hover{background:rgba(255,255,255,.11)}var MONTHS = ['Jan','Feb','Mar','Apr','May','Jun','Jul','Aug','Sep','Oct','Nov','Dec'];
var FULL = [42, 48, 45, 58, 63, 61, 74, 82, 79, 95, 104, 118];
var range = 12;
var extra = 0;
var money = function (n) { return '$' + n.toLocaleString() + 'k'; };
function slice() {
var vals = FULL.slice(-range);
var labels = MONTHS.slice(-range);
for (var i = 0; i < extra; i++) {
vals = vals.concat([vals[vals.length - 1] + Math.round((Math.random() - 0.35) * 22)]);
labels = labels.concat(['+' + (i + 1)]);
}
return { labels: labels, vals: vals };
}
// Chart.js calls scriptable options during layout, BEFORE chartArea exists on
// the very first pass — returning early avoids the classic "gradient is null" crash.
function areaGradient(ctx) {
var chart = ctx.chart;
var area = chart.chartArea;
if (!area) return 'rgba(94,234,212,0.18)';
var g = chart.ctx.createLinearGradient(0, area.top, 0, area.bottom);
g.addColorStop(0, 'rgba(94,234,212,0.42)');
g.addColorStop(0.55, 'rgba(56,189,248,0.14)');
g.addColorStop(1, 'rgba(56,189,248,0)');
return g;
}
var start = slice();
var chart = new Chart(document.getElementById('crcChart'), {
type: 'line',
data: {
labels: start.labels,
datasets: [{
data: start.vals,
borderColor: '#5eead4',
borderWidth: 2.5,
backgroundColor: areaGradient,
fill: true,
tension: 0.38,
pointRadius: 0,
pointHoverRadius: 6,
pointHoverBackgroundColor: '#5eead4',
pointHoverBorderColor: '#0a0d1c',
pointHoverBorderWidth: 3
}]
},
options: {
responsive: true,
maintainAspectRatio: false,
// Without this the tooltip only fires when the cursor is near the line itself.
interaction: { mode: 'index', intersect: false },
animation: { duration: 700, easing: 'easeOutQuart' },
plugins: {
legend: { display: false },
tooltip: {
backgroundColor: '#0a0d1c',
borderColor: 'rgba(255,255,255,.14)',
borderWidth: 1,
padding: 12,
displayColors: false,
titleColor: '#8f9ab8',
bodyColor: '#fff',
bodyFont: { size: 15, weight: '700' },
callbacks: { label: function (c) { return money(c.parsed.y); } }
}
},
scales: {
x: {
grid: { display: false },
border: { display: false },
ticks: { color: '#6b7595', font: { size: 11 } }
},
y: {
beginAtZero: true,
grid: { color: 'rgba(255,255,255,.055)' },
border: { display: false },
ticks: { color: '#6b7595', font: { size: 11 }, maxTicksLimit: 5, callback: function (v) { return '$' + v + 'k'; } }
}
}
}
});
function refresh() {
var d = slice();
chart.data.labels = d.labels;
chart.data.datasets[0].data = d.vals;
// 'active' reuses the running animation config so bars/points glide to the
// new values instead of the whole chart being torn down and redrawn.
chart.update('active');
var total = d.vals.reduce(function (a, b) { return a + b; }, 0);
document.getElementById('crcTotal').textContent = money(total);
var half = Math.floor(d.vals.length / 2);
var older = d.vals.slice(0, half).reduce(function (a, b) { return a + b; }, 0) || 1;
var newer = d.vals.slice(half).reduce(function (a, b) { return a + b; }, 0);
var pct = Math.round(((newer - older) / older) * 100);
var delta = document.getElementById('crcDelta');
delta.textContent = (pct >= 0 ? '+' : '') + pct + '%';
delta.classList.toggle('down', pct < 0);
}
refresh();
document.getElementById('crcRanges').addEventListener('click', function (e) {
var chip = e.target.closest('.crc-chip');
if (!chip) return;
document.querySelectorAll('.crc-chip').forEach(function (c) { c.classList.remove('is-on'); });
chip.classList.add('is-on');
range = Number(chip.dataset.range);
extra = 0;
refresh();
});
document.getElementById('crcAdd').addEventListener('click', function () {
extra++;
refresh();
});Extend with AI
Take This Snippet Further With AI
The AI prompt for this one is for Patreon supporters ($3 a month, 7 days free), along with a site with no ads. Supporters enter the passcode once and it is remembered in this browser.
What's included
Features
About this UI Snippet
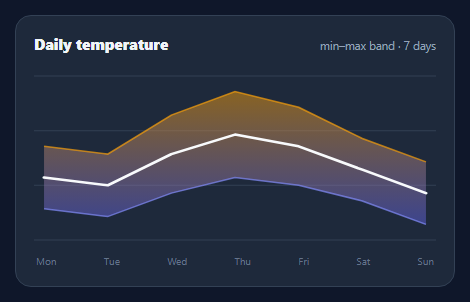
Chart.js Gradient Revenue Chart — Scriptable Options and Animated Updates
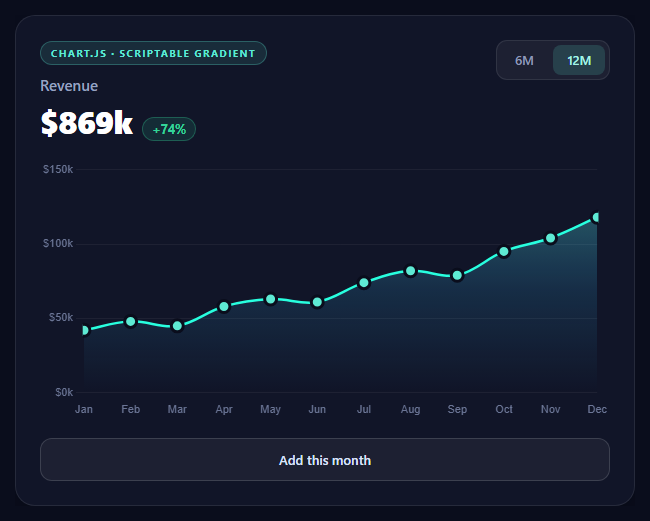
Chart.js gets you a working chart in about ten lines. Getting one that looks like it belongs in a designed product takes a handful of specific options, and two of them are the source of nearly every Stack Overflow question about the library.
The gradient that crashes on first render
A vertical gradient under an area line is the most requested Chart.js customization, and the naive version throws:
var g = ctx.createLinearGradient(0, chartArea.top, 0, chartArea.bottom); // TypeError
The reason is ordering. A canvas gradient needs pixel coordinates, and the chart does not know its own plot area until it has laid out — but backgroundColor is read *during* that layout. On the first pass chart.chartArea is genuinely undefined.
The fix is to pass a scriptable option — a function rather than a value — and guard it:
if (!area) return 'rgba(94,234,212,0.18)';
Chart.js calls the function again once layout completes, so the flat fallback color is only ever used for a single frame. The same pattern applies to any option that needs to know the chart's geometry, and it also means the gradient regenerates on resize automatically, which a gradient created once at setup would not.
interaction.mode, the option that fixes tooltips
Default Chart.js only shows a tooltip when the cursor is close to an actual data point. On a smooth line with pointRadius: 0, that means hovering feels broken — the user waves the mouse across the chart and nothing happens.
interaction: { mode: 'index', intersect: false }
intersect: false stops requiring a direct hit, and mode: 'index' selects whichever x-position the cursor is nearest. Together they turn the chart into a continuous readout: move anywhere along it and the tooltip tracks the nearest month. This single option does more for perceived quality than any styling.
Points are then hidden at rest (pointRadius: 0) and only appear on hover (pointHoverRadius: 6) with a background-colored border, which makes the hovered point read as punched out of the line rather than sitting on top of it.
Updating without destroying
The most common mistake in dashboards is calling chart.destroy() and constructing a new chart whenever data changes. That throws away the animation state, so every update flashes.
chart.data.datasets[0].data = d.vals; chart.update('active');
Mutating the data in place and calling update() makes Chart.js interpolate from current values to new ones, so the line visibly glides. The 'active' argument reuses the running animation configuration rather than replaying the initial one. Because the range toggle and the add-a-month button both route through one refresh() function, every update path animates identically and the summary figures can never disagree with the chart.
Styling that gets out of the way
The defaults are built for standalone charts, not embedded panels. Four changes do most of the work:
- legend: { display: false } — a single series does not need a legend explaining it.
- grid: { display: false } on the x axis and a very faint rgba(255,255,255,.055) on the y — horizontal guides help read values; vertical ones are noise.
- border: { display: false } on both axes — the Chart.js 4 way to remove axis spines, which moved out of gridLines in v3.
- maxTicksLimit: 5 — caps y-axis labels regardless of the value range, so the axis never crowds.
tension: 0.38 curves the line. It is worth knowing this is a *smoothing* value with no relationship to the underlying data — high tension on volatile data invents peaks between points that were never measured. For revenue it is honest enough; for anything where exact values matter, keep it low.
Sizing
maintainAspectRatio: false plus a fixed-height wrapper (.crc-canvas { height: 260px }) is the correct pattern for a chart inside a layout. Left on, Chart.js enforces its own aspect ratio and fights your container. The canvas needs a *positioned, sized* parent — sizing the canvas element directly does not work reliably.
Reusing it
Replace FULL with your series and everything downstream follows, including the total and the period-over-period delta. For a sparkline-sized version, drop the axes and tooltip; for a dependency-free alternative, compare area chart or realtime line chart.
Step by step
How to Use
- 1Add the Chart.js CDNInclude the chart.umd build from the CDN panel — global Chart.
- 2Paste HTML, CSS, and JSA gradient area chart animates in with a live total and delta.
- 3Hover anywhereIndex-mode tooltips track the nearest month without needing a direct hit.
- 4Switch the range6M and 12M mutate the dataset and animate between them.
- 5Add a monthNew points glide in — the chart is updated, never destroyed.
- 6Plug in your dataReplace the FULL array; total and delta derive from it.
Real-world uses
Common Use Cases
chartArea guard that returns a fallback on first layout instead of crashing, one of the most common sources of Chart.js gradient errors.Got questions?
Frequently Asked Questions
A canvas gradient needs pixel coordinates from chart.chartArea, but backgroundColor is read during layout — before the chart knows its own plot area. On the first pass chartArea is undefined. Passing a scriptable function that returns a flat fallback color when chartArea is missing fixes it, and Chart.js calls the function again after layout so the gradient appears immediately.
Chart.js defaults to requiring the cursor to intersect an actual data point, which feels broken on a smooth line with hidden points. Setting interaction to { mode: "index", intersect: false } removes the hit requirement and selects the nearest x position instead, so hovering anywhere over the plot reads the nearest value.
Destroying discards the animation state, so every data change flashes. Mutating chart.data in place and calling chart.update() makes Chart.js interpolate from the current values to the new ones, so the line glides. Passing "active" reuses the running animation configuration rather than replaying the initial entrance.
It applies bezier smoothing between points. It is purely cosmetic and has no relationship to the underlying data, so high tension on volatile series invents visual peaks between measurements that never existed. It is fine for a smooth revenue trend, but keep it low or at zero wherever exact values matter.
Left on, Chart.js enforces its own width-to-height ratio and fights whatever container it is in. Turning it off and giving the canvas a positioned parent with an explicit height lets the layout own the sizing. Setting dimensions on the canvas element directly does not work reliably.
react-chartjs-2 and vue-chartjs wrap the lifecycle for you and accept the same data and options objects. With the vanilla build, create the chart in a mount effect against a canvas ref, keep the instance in a ref, and call chart.destroy() in cleanup or remounts leak canvases. Update by mutating the instance data and calling update() rather than recreating on every render.